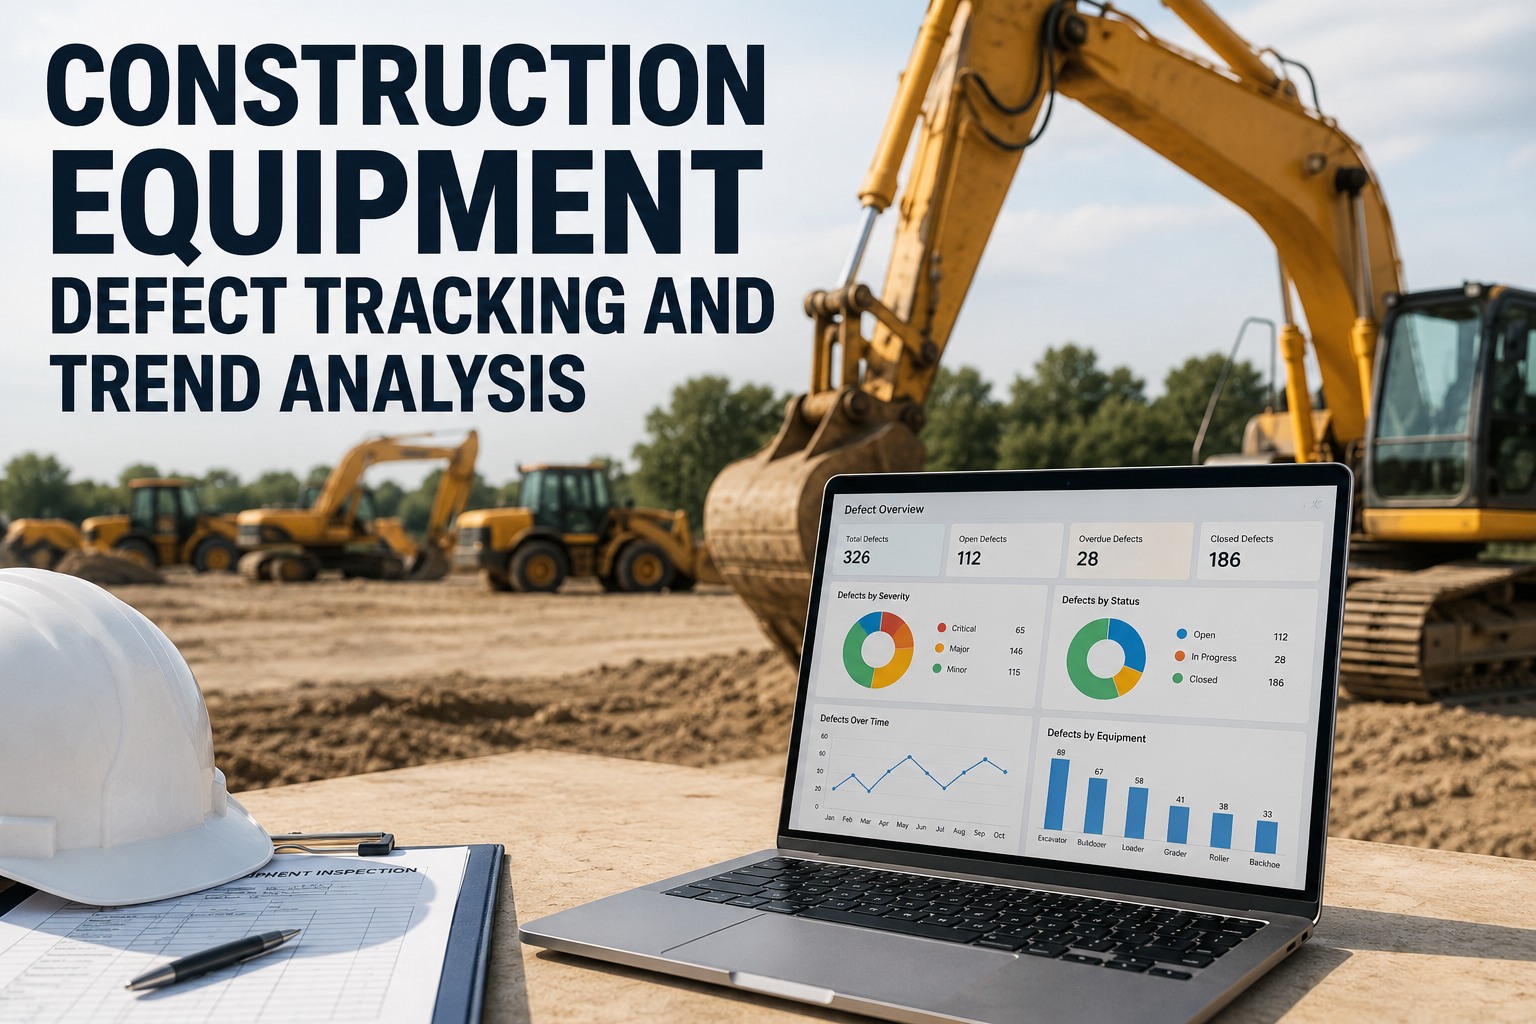
One excavator losing a hydraulic hose is bad luck. The same hose failing on six excavators across two sites in one quarter is a pattern - and patterns are where the money leaks out of a fleet. That is the whole case for equipment defect tracking done properly: individual defects are noise, but defect trend analysis turns that noise into a signal you can act on before it becomes ten breakdowns, ten idle crews and ten urgent parts orders. The problem is that paper defect books, spreadsheet logs and photos buried in group chats make pattern detection almost impossible, because nobody can see ten machines at once. This guide shows you how to structure defect categories so trending actually works, the three repeat-defect patterns worth hunting, and how to turn a trend into a fix - a spec change, a routing change or operator training - using the same defect analytics approach you can see running on your own fleet in a 30-minute demo.
Defect Trend Analysis for Construction Fleets
The defect that keeps coming back is the one that costs you the most
A single hydraulic hose failure might cost you a morning. The same failure repeating across a machine class costs you a season. Trend your defects by component, site and operator, and the pattern tells you exactly where to spend the next maintenance dollar.
- Same component failing across a whole machine class
- Same defect clustering on one site or one contract
- Same damage appearing under one operator or shift
What Repeat Defects Actually Cost
Four numbers that make defect trend analysis worth your time
Every figure below is money you either keep or lose depending on whether you catch a pattern at failure number two or failure number twelve.
Structure First
How to structure defect categories so trending actually works
Trend analysis fails at the data-entry step, not the reporting step. If one operator writes "hose burst," another writes "hydraulic leak" and a third writes "oil everywhere," your dashboard sees three unrelated events. Fix the categories first and the patterns surface on their own.
System
The big bucket: hydraulics, electrical, braking, engine, driveline, tyres/tracks, structure, cab and safety. Eight to ten systems maximum. Any more and operators start guessing.
Component
The part inside the system: hose, fitting, pump, cylinder, wiring harness, alternator, slack adjuster. This is the level where trends actually appear, so keep the list tight and consistent.
Failure Mode
What happened to it: leaking, chafed, cracked, worn, loose, corroded, failed outright. "Chafed hose" and "burst hose" point at different root causes - routing versus pressure - so the distinction matters.
Context Tags
Where and under whom: site, machine class, operator, shift. Captured automatically when the inspection app already knows the asset, the logged-in user and the project.
The rule of thumb: if a category needs more than two taps to select on a phone, operators will pick "other" and your data dies. A digital defect reporting app with picklists and mandatory photo capture keeps every defect in the same shape, which is exactly what makes a walkthrough of trend views on real fleet data worth thirty minutes.
Pattern Hunting
The three repeat-defect patterns worth hunting every month
Almost every expensive fleet problem hides in one of these three cuts of the same defect data. Review them monthly - it takes minutes on a dashboard, weeks on paper.
Same component, same machine class
Five of your eight 20-tonne excavators log turbo failures inside 4,000 hours. That is not bad luck - it is a spec, supplier or PM-interval problem. The fix is a conversation with the dealer, a revised service interval, or a different part on the next order, applied fleet-wide instead of machine by machine.
Action: specification change, supplier claim, or PM schedule adjustment.
Same defect, one site
Tyre sidewall damage triples on one contract while every other site stays flat. The machines are the same, the operators rotate - so the cause is the haul road, the loading practice or the debris on that site. You take the trend to the site supervisor with dates and photos, not opinions.
Action: site condition fix, route change, or a commercial conversation with the client.
Same damage, one operator
Bucket edge wear, overheating events and hydraulic shock faults cluster on whichever machine one operator runs. That is a training gap, not a parts problem - and it is costing you components across the whole fleet. The trend view gives you a factual, non-confrontational starting point for coaching.
Action: targeted operator training with a follow-up trend check in 60 days.
Worked Example
Hydraulic hose failures on one site: a routing problem, not a parts problem
Here is what recurring defect detection looks like in practice, on numbers any plant manager will recognise.
What the paper log showed
- Nine hydraulic hose replacements across four excavators in one quarter
- Logged as "hose failed - replaced" with no photos and no failure mode
- Parts team blamed the hose supplier and switched brands twice
- Roughly $1,100 per event in parts, labour and lost machine time - about $9,900 for the quarter
What the trend view showed
- All nine failures were the same hose position, same failure mode: chafed, not burst
- All nine were on one site - a demolition job with machines working at full reach against rebar
- Photos attached to each defect showed the hose rubbing a clamp at full boom extension
- Fix: reroute and re-clamp, $40 per machine. Failures stopped. The "bad parts" were never bad.
The lesson is not about hoses. It is that the root cause only became visible when defects were categorised consistently, tagged by site and backed by photos. Without that structure, the fleet would still be swapping hose brands and paying $1,100 a time. If you want to test this on your own recurring headache, start logging defects free and watch the first month of data.
See your fleet's repeat defects on one dashboard
Book a 30-minute demo and we will load a sample of your equipment types so you can see defect trends by component, site and operator on data that looks like yours.
From Trend to Fix
Turning a defect trend into a spec change or a training fix
A trend nobody acts on is just trivia. This is the four-step loop that converts a defect pattern into a permanent fix - and proves the fix worked.
Confirm the pattern with evidence
Pull every defect in the cluster: same component, same failure mode, plus the timestamped photos attached at capture. Photo evidence is what makes retrospective review meaningful instead of guesswork - you are comparing what actually failed, not what someone remembers writing.
Isolate the variable
Cut the cluster by machine class, site and operator. If it follows the machine class, suspect the spec or the part. If it follows the site, suspect conditions or application. If it follows a person, suspect technique. One of the three cuts will light up.
Apply one intervention
Change one thing: a reroute kit, a different supplier, a revised PM interval, a site housekeeping fix, or a half-day of operator coaching. Log it as a work order against the affected assets so the intervention itself is on record with a date and a cost.
Watch the same trend for 60-90 days
Set a reminder to re-run the same defect view. If the cluster flatlines, the root cause is confirmed and you roll the fix out fleet-wide. If it does not, you have learned the variable was wrong - cheaply, and with data instead of argument. This loop is exactly what a demo of the analytics module walks through on live screens.
Paper vs Digital
Why paper defect books hide the patterns that cost you most
Nobody can trend what they cannot see side by side. Here is the honest comparison for construction equipment defects captured on paper versus in a CMMS.
| Question | Paper defect books and spreadsheets | Digital defect tracking in HVI |
|---|---|---|
| Are defects categorised consistently? | No - every operator writes free text, spelling and wording vary daily | Yes - picklists for system, component and failure mode on every report |
| Can you see one component across ten machines? | Only by reading ten books line by line | One filter on the fleet defect dashboard |
| Is there photo evidence per defect? | Rarely - photos live in personal phones and group chats | Mandatory photo capture attached to the defect record |
| Can you cut defects by site or operator? | Not without manually rebuilding the data | Automatic - asset, site and user are tagged at capture |
| Does a defect become a repair automatically? | Someone has to remember to tell the workshop | Instant defect-to-work-order with the photos attached |
| How long does a monthly trend review take? | Days - and it usually never happens | Minutes, on the company-level dashboard |
How HVI Helps
Defect analytics built for mixed construction fleets
HVI (Heavy Vehicle Inspection and Maintenance, by JRS Innovation Inc.) is cloud plus mobile inspection and work order CMMS software. Four capabilities do the heavy lifting for defect trend analysis.
Structured defect capture with photos
Operators log defects on any phone or tablet using your category picklists, with mandatory photo evidence. Every defect lands in the same shape, tagged with asset, site and user - the raw material trending needs.
Analytics and defect trend views
The Analytics and Reporting module tracks insights and KPIs across the fleet, with defect trend views on the company-level dashboard. Spot common defects across machines, sites and operators in minutes, not months.
Instant defect-to-work-order
A confirmed defect converts to a work order with the photos and history attached, so the workshop fixes the right thing the first time and the repair closes the loop on the trend.
Inspection compliance you can prove
See who is completing required inspections and confirm in-service machines are being inspected regularly. Timestamped, photo-backed records stand up in DOT, client, safety and insurance audits in seconds.
HVI runs across trucks, trailers, buses, off-road plant and shop equipment in one platform, and most fleets are live in days with minimal operator training. Create a free account or book a demo on your own units.
Key Takeaways
Equipment defect tracking that pays for itself
If you remember nothing else from this page, remember these five points.
- Individual defects are noise; patterns are signal. The expensive problems in a fleet are repeats, and repeats are only visible across machines, sites and time.
- Structure beats volume. Four levels - system, component, failure mode, context - captured the same way every time, matter more than how many defects you log.
- Hunt three patterns monthly: same component across a machine class, same defect at one site, same damage under one operator. Each points to a different fix.
- Photos make trends provable. Timestamped evidence turns "we think the hoses are bad" into "the clamp rubs at full reach - here are nine photos."
- Close the loop. One intervention, logged as a work order, re-checked against the same trend in 60-90 days. That is how equipment failure trends become reliability gains instead of reports nobody reads.
Fleets that run this loop typically find their repeat-defect share - often a fifth or more of all defects - is the cheapest downtime they will ever eliminate. The tooling to do it is not the hard part anymore; see it working in a 30-minute session and judge for yourself.
"I used to find out about a repeat failure when the third machine came in for the same part. Now I run the defect trend every Monday with my coffee - last quarter it flagged slew-motor faults on one site before the second failure, and the photos showed the operators were tracking over spoil piles daily. One toolbox talk fixed what parts swapping never would have. I watch repeat-defect count the way I used to watch breakdowns."
Marcus Delaney - Maintenance Manager, mid-size civil and earthworks contractor
FAQ
Defect tracking and trend analysis: common questions
What is equipment defect tracking in a construction fleet?
How many defect categories do I need for trend analysis to work?
How often should I review defect trends?
Can defect trend data help with warranty and supplier claims?
Do operators actually use a defect reporting app, or is it more paperwork?
Catch the pattern at failure two, not failure twelve
Put every defect from every machine, site and operator on one dashboard - categorised, photo-backed and trended automatically. Book a demo and we will show you the trend views on equipment types from your own fleet.
Free to start - Works on any phone or tablet - No card needed