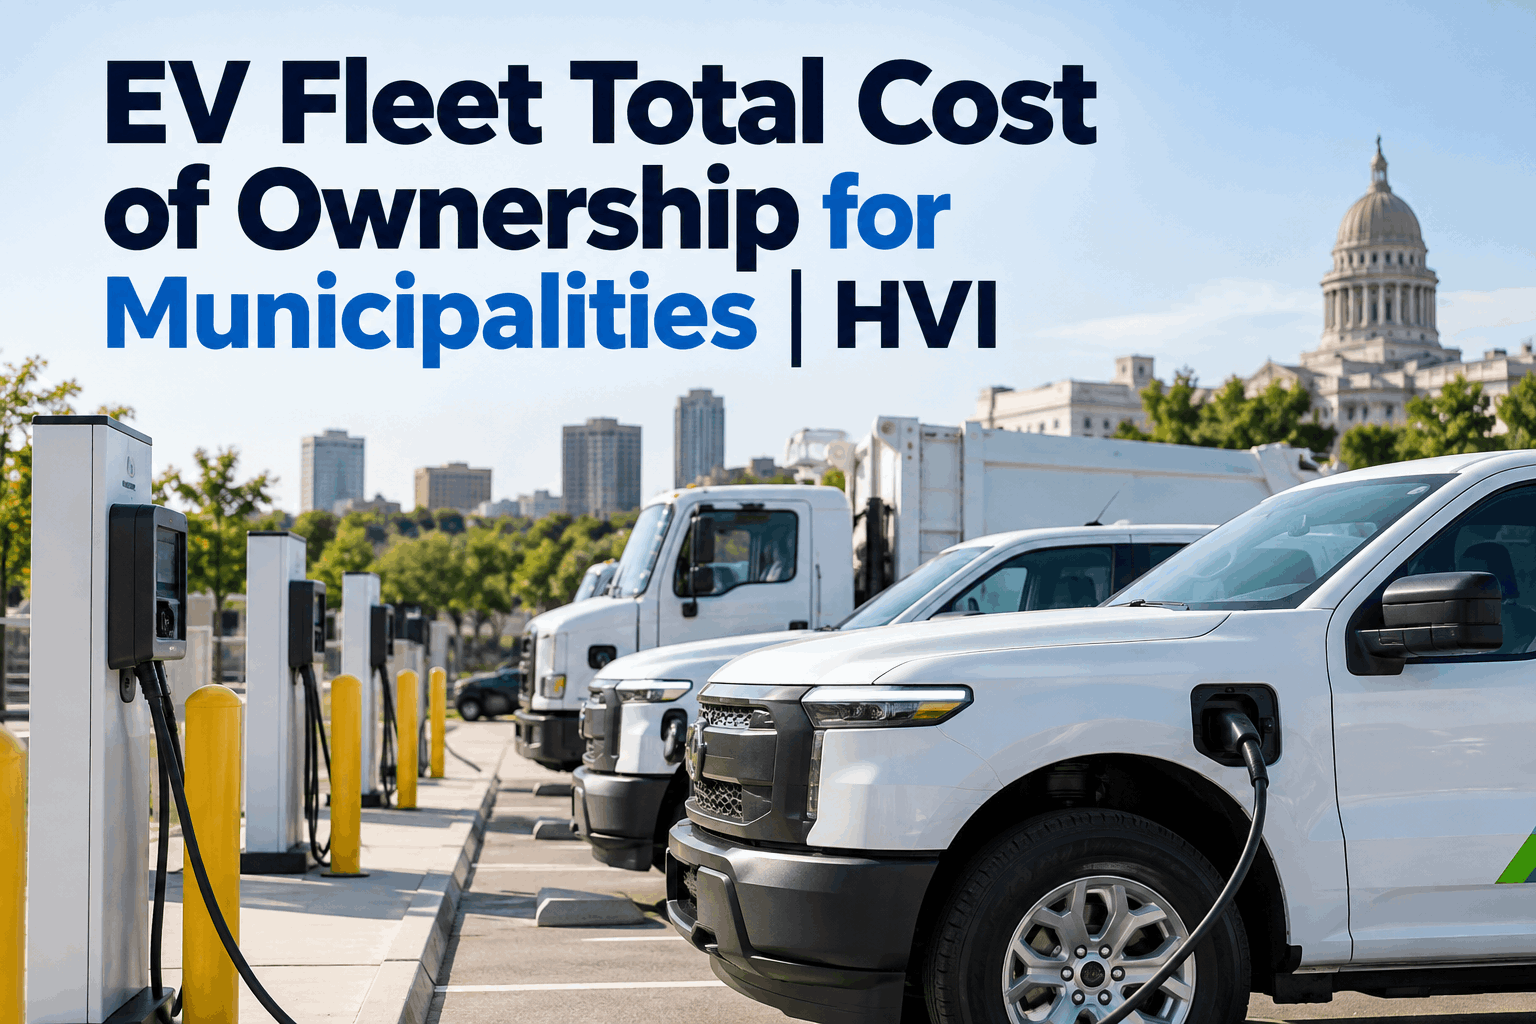
Every EV fleet conversation in a city council chamber dies on the same slide: the sticker price. An electric refuse truck or F-150 Lightning costs more upfront than its diesel twin, and that one number sinks the vote. But the EV fleet total cost of ownership — acquisition, charging, energy, maintenance, incentives and residual value across the asset's full life — tells a different story, and it's the number your budget committee actually needs to see. Book a demo to see how a documented TCO case gets built.
The number that wins the vote isn't the sticker price — it's the one underneath it
Sticker price is a single day. Total cost of ownership is the decade. Here's how the two bars flip.
Illustrative medium-duty figures for direction — your real numbers depend on duty cycle, electricity rate and incentive stack
A total cost of ownership case isn't one figure — it's six cost categories that each behave differently for electric and diesel. Some swing hard toward EV, one or two favor diesel, and the net is what you defend in front of the council. Read it like a ledger, not a brochure.
The six line items in a municipal EV TCO
Each row shows which powertrain the dollars move toward over a full service life — and the specific driver behind it. This is separate from a pure heavy-duty return comparison; for the asset-level crossover math, see our EV fleet ROI calculator guide.
EV sticker runs roughly 20–40% higher on medium- and heavy-duty municipal units today. It's the only line diesel clearly wins — and the one that incentives are built to erase.
Electricity is cheaper and far more price-stable than diesel. On return-to-base municipal routes, energy cost per mile is the single largest recurring saving in the whole model — and the one a council can feel every month.
An electric drivetrain has a fraction of the moving parts of a diesel one — no oil changes, no exhaust aftertreatment, far less brake wear thanks to regen. Austin's municipal EV fleet has reported roughly 52% maintenance savings against its combustion units.
Depot chargers and the electrical upgrade behind them are a real upfront cost diesel doesn't carry. But it's a capital asset shared across many vehicles and years — and utility rebates often cover up to 50% of the charger itself. Budget it once; amortize it across the fleet.
Federal credits reach up to $7,500 per light-duty and up to $40,000 per heavy-duty EV, stacked with state Clean Fleet grants and utility programs. Diesel gets none of this — but you can only claim what you can document.
The EV resale market is maturing, and the three-year depreciation gap against diesel keeps narrowing. A clean, documented service and battery-health history is what protects that residual when the unit finally leaves your yard.
The sticker-price trap
Most municipal EV proposals lose in the room because they're argued on the wrong number. Here's the trap — and the reframe that gets a council to vote yes.
The EV costs more upfront, so the proposal is framed as "spending more." The decision gets made on acquisition cost alone, and the vote fails before energy, maintenance and incentive savings ever enter the math.
Reframed on full lifecycle cost, that same unit is cheaper to own over a decade once energy, maintenance, incentives and residual value are netted in. Same truck, opposite conclusion — the only thing that changed is which number you argued.
The lesson isn't "EVs are always cheaper" — some duty cycles still favor diesel. It's that the decision has to be made on the lifecycle number, and that number has to be defensible with your own operating data, not a vendor's brochure. Book a demo to see per-vehicle lifecycle cost tracked automatically.
Stacking the incentives that erase the sticker gap
The acquisition premium is the one line diesel wins — and incentives exist specifically to close it. For public fleets they stack, each layer subtracting from the price the council sees. This is where a government fleet turns an "expensive" EV into a net-cheaper one.
-
$92,000Gross EV sticker price
-
−$40,000Federal commercial clean-vehicle credit (heavy-duty)
-
−$4,000State Clean Fleet grant (per vehicle, where available)
-
up to −50%Utility rebate on the depot charger (infrastructure, not the vehicle)
-
~$48,000Net effective price — now below the diesel it replaces
Incentive programs and amounts shift by state, utility and model year, and several carry first-come, first-served deadlines — so treat these as the shape of the stack, not fixed figures. The constant is this: grants reward fleets that can prove their numbers. Start free and log the cost history your grant applications will ask for.
Where the savings actually show up
Three recurring lines carry most of the lifecycle advantage. These are the figures worth putting on your council slide — each tied to what it means for the operating budget.
lower maintenance cost reported on Austin's municipal EV fleet vs. its combustion units — the line your shop feels first
fuel cost saving in the same program — energy per mile is the biggest recurring item in the model
federal credit available per heavy-duty EV, stackable with state and utility programs you can only claim if documented
From a fleet director who ran the numbers
Council didn't care about emissions — they cared about the capital line. The first proposal failed because I led with the purchase price and watched their faces close up.
Second time I brought our own energy-per-mile and maintenance-per-unit data off the dashboard, netted in the federal credit and the charger rebate, and showed the ten-year number. It passed unanimously. The data we'd already been logging was the whole argument.
Building a TCO case you can defend
A projected TCO convinces no one twice. What survives a budget cycle is a case backed by your own numbers — which means the tracking has to be running before, not after, the proposal. Map each category to a real data source with fleet maintenance management and analytics reporting.
Energy & fuel cost
Log cost per mile for both EV and diesel units in one place, so the biggest recurring saving is a measured number, not a claim.
Maintenance spend
Capture every work order and part by unit. The EV-vs-ICE maintenance gap becomes a line item you can actually footnote.
Lifecycle & residual
A complete service and inspection history on each asset supports residual value and feeds the lifecycle-cost analytics your council slide needs.
Grant documentation
Clean, exportable cost and compliance records are exactly what competitive grant applications ask for — you can't win funding you can't document.
Frequently asked questions
Is an EV fleet really cheaper than diesel for a municipality?
Usually, over the full lifecycle — not on day one. The higher sticker price is offset by lower energy and maintenance costs, incentives and improving residual value. On return-to-base municipal routes it often nets cheaper within a few years. Some specialized or high-mileage duty cycles still favor diesel, so run your own numbers per vehicle class.
What goes into an EV fleet total cost of ownership calculation?
Six categories: acquisition, charging infrastructure, energy vs. fuel, maintenance, incentives and residual value — measured across the asset's full service life, not just the purchase. Acquisition and infrastructure are upfront costs; energy, maintenance and incentives are where EVs claw it back.
Should charging infrastructure count in the TCO?
Yes, but as a shared capital asset, not a per-vehicle cost. Depot chargers and the electrical upgrade are a one-time outlay spread across many vehicles and years, and utility rebates often cover a large share. Amortize it across the fleet rather than loading it onto the first EV.
What incentives can municipal fleets stack?
Federal commercial clean-vehicle credits (up to $7,500 light-duty, up to $40,000 heavy-duty) can combine with state Clean Fleet grants and utility charger rebates. Amounts and deadlines vary by location and model year, and many are first-come, first-served — verify current eligibility before you budget.
How does HVI help build the TCO case?
HVI tracks energy and fuel cost per mile, logs maintenance spend by unit, and trends lifecycle cost across a mixed EV-and-diesel fleet. That turns a projected TCO into documented data you can defend to a council and attach to grant applications. It's a cost and maintenance layer, not a vehicle-selection or grant-guarantee tool.
Turn your EV fleet TCO from an estimate into evidence
Track cost per mile, maintenance spend and lifecycle cost per vehicle across your whole fleet — electric and diesel side by side — and walk into your next budget meeting with numbers nobody can argue with. Live in weeks, not quarters.
No credit card · Works across mixed EV and diesel fleets · Cost dashboard from day one