A public fleet rarely buys the cheapest vehicle — it buys the one that looks cheapest on the purchase order. The sticker price is the one number procurement sees and it is the smallest part of what the vehicle actually costs. Fleet total cost of ownership is the rest of the iceberg. Book a demo to see cost tracked per vehicle and department.
The purchase price is the tip — the lifecycle is the iceberg
What the council approves is the sticker. What the fleet actually spends is everything under the waterline — and it's roughly three times bigger.
Illustrative medium-duty figures for direction — real whole-life cost depends on class, duty cycle and years in service
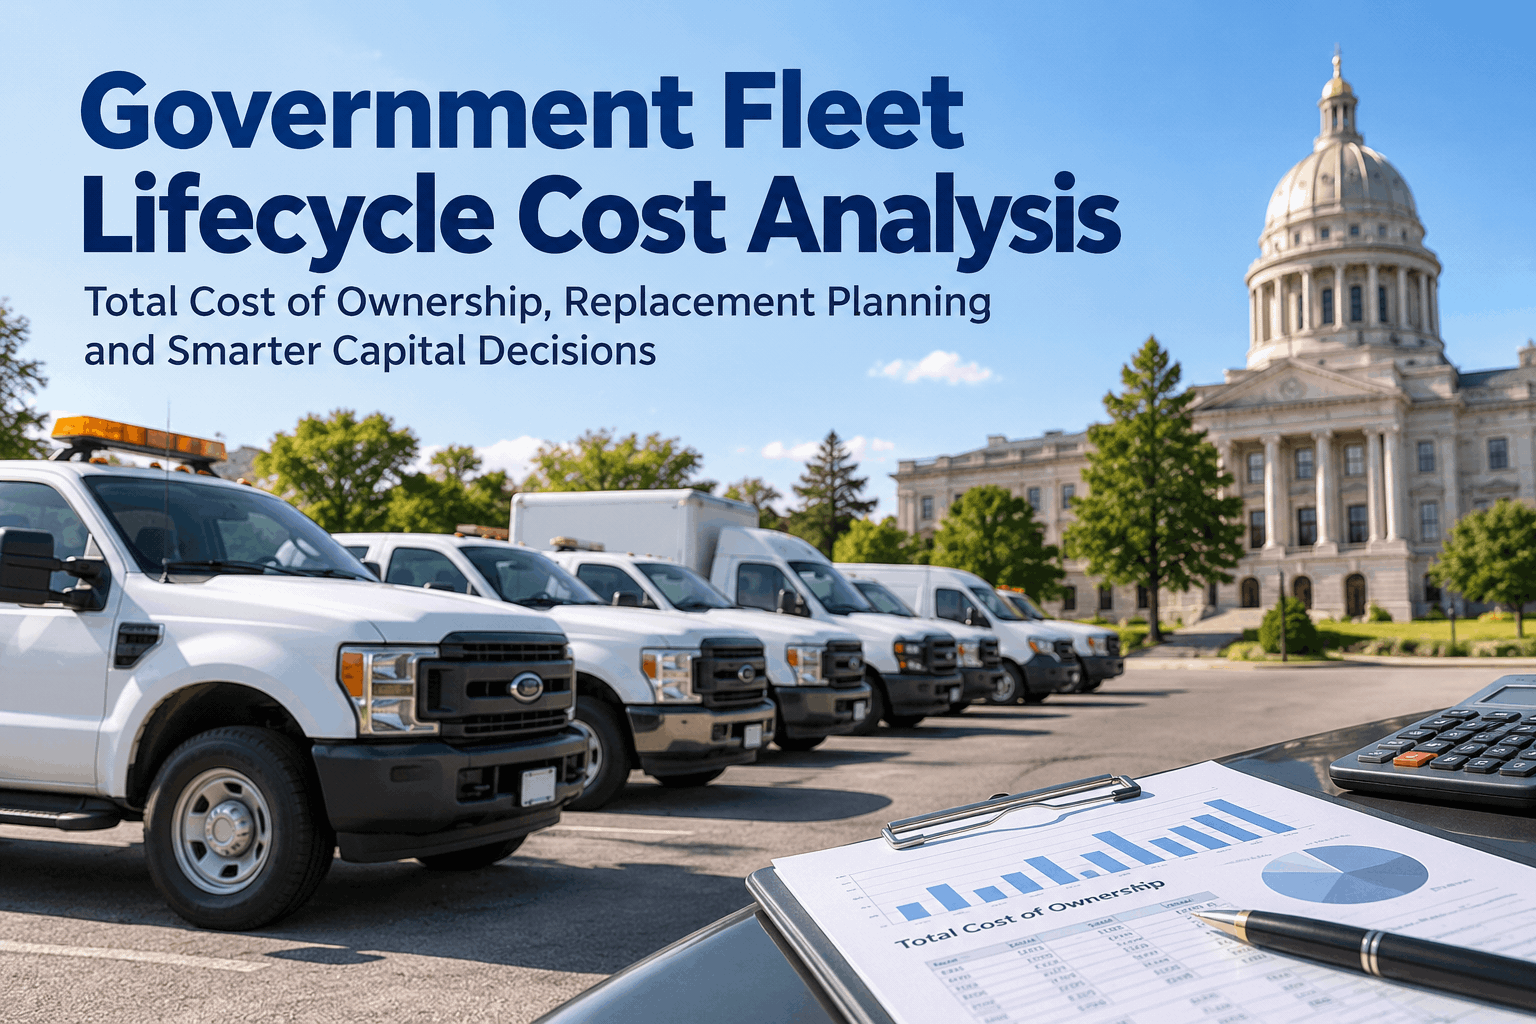
Buying on sticker price alone is how a fleet ends up with cheap trucks that cost a fortune. A real fleet total cost of ownership model counts every dollar a vehicle will absorb from the day it arrives to the day it's sold — and for most public fleets that's roughly three times the purchase price. Here's how the number is built, why it climbs with age, and how it turns procurement from a guess into arithmetic.
The five costs that make up fleet TCO
Total cost of ownership isn't one figure — it's five stacked costs, four that add and one that subtracts. This is the public-fleet lifecycle model; it's a different question from choosing an electric powertrain, which our EV fleet TCO guide covers separately.
Purchase or financing — the only cost most procurement decisions actually weigh.
Usually the largest recurring line over a vehicle's life, and the one that climbs as efficiency drops with age.
Flat early, then rising sharply in the back half of the vehicle's life — the curve that decides replacement timing.
The cost public fleets forget — overtime, a backup unit, and a service the public notices when the vehicle is in the shop.
What the unit returns at disposal — protected by a clean, documented service history, eroded by a patchy one.
Three times the sticker — the number procurement should be comparing, not the purchase price.
Fuel and maintenance together dwarf the purchase price, yet they never appear on the PO. Once each line is measured per vehicle, "which truck is cheapest" becomes a question you can answer with data instead of instinct. Book a demo to see whole-life cost built per unit.
Why the number climbs with age
The reason TCO matters for public fleets is the cost-per-mile curve. A vehicle gets cheaper to own for a few years as the purchase price spreads out — then maintenance and downtime take over and the line turns back up. The low point is the economic replacement window.
Purchase price spreads over more miles; maintenance is still minimal. Cheapest years to own.
Depreciation has slowed and major repairs haven't started. This is the economic sweet spot — and the replacement window.
Repair frequency and downtime climb; fuel efficiency drops. Cost per mile runs well above a newer unit.
Kept past its economic life "to save money," it now costs far more per mile than the replacement would — the most common public-fleet trap.
Most public fleets run vehicles well past the low point because replacement capital is hard to win — but without per-vehicle cost data, you can't prove the old unit is now the expensive one. This is distinct from the repair-or-replace call on a single breakdown, which our replacement vs. refurbishment guide walks through. Start free and track cost per mile by vehicle age.
The procurement reframe
The whole point of a fleet TCO model is to change the question procurement asks. Here's the shift that saves a public fleet more than any single purchase negotiation.
"Which unit has the lowest purchase price?" The cheapest truck wins the PO, then quietly costs the most in fuel, repairs and downtime for the next decade — a decision that looked frugal and wasn't.
"Which unit has the lowest cost per mile over its service life?" A slightly pricier truck that's cheaper to run and holds resale wins — and you can prove the saving to the council with your own numbers.
Same budget line, opposite outcome. The only thing that changed is which number the decision was built on — and whether you had the data to defend it. Book a demo to see per-mile cost across your fleet.
The numbers behind the public-fleet case
Three figures worth putting in front of a budget committee — each one a reason the whole-life number, not the sticker, should drive procurement.
the purchase price is roughly what a vehicle costs over its full service life once fuel, maintenance and downtime are counted
higher cost per mile on vehicles ten years or older vs. newer units — the back-half of the curve, measurable per unit
where the economic replacement point typically falls — the window keeping a unit longer starts costing more than replacing it
None of these are the kind of figure you can estimate in a budget meeting — they only carry weight when they're your own fleet's numbers. Book a demo to see these metrics on your vehicles.
From a fleet director who built the model
We replaced vehicles on age rules and whoever complained loudest, and procurement always chased the lowest bid. Once we had real cost-per-mile by unit, the argument flipped — I could show a nine-year-old packer was costing us double a new one, and that the "cheap" truck we'd bought three years back was the most expensive in the yard. The capital request wrote itself.
How HVI builds your fleet TCO — feature by feature
A TCO model is only as good as the data feeding it, and that data has to be captured in the normal course of running the fleet — not reconstructed at budget time. Each capability below feeds one part of the whole-life number.
Fuel & energy cost per mile
Fuel log tracking ties consumption to each unit, so the largest lifecycle line is a measured number, not an estimate.
Maintenance spend by unit
Work order and parts tracking captures every repair dollar — the rising back-half of the cost curve, per vehicle.
Downtime and availability
Inspection and work-order timestamps show how long each unit sits out of service — the cost that never makes the spreadsheet.
Service history for resale
A complete, signed inspection and maintenance record travels with the asset and protects its disposal value.
Cost per mile, trended by age
Analytics dashboards turn the raw costs into the per-mile curve that flags the economic replacement point.
Cost by vehicle and department
Every number rolls up by unit and division — the exact view procurement and finance need to compare and defend.
Captured this way, the TCO model is a live report, not a once-a-year scramble — and every procurement and replacement decision runs on the real number. Start free and build your fleet's lifecycle cost model.
Frequently asked questions
What is fleet total cost of ownership?
The full cost of a vehicle across its service life — acquisition, fuel, maintenance, downtime and administration, minus resale value — not just the purchase price. For most public-fleet vehicles it works out to roughly three times the sticker, which is why buying on price alone is misleading.
Which cost is biggest in fleet TCO?
Over a full life, fuel is usually the largest single line, with maintenance close behind and climbing in later years. Both typically exceed the purchase price on their own — yet neither appears on the procurement decision, which is the core blind spot a TCO model fixes.
When should a public fleet replace a vehicle?
At the economic replacement point — where cost per mile stops falling and starts rising, usually around years seven to nine for public-fleet units. Keeping a vehicle past that point costs more per mile than a replacement, even though no new capital is spent.
How does TCO change fleet procurement?
It changes the question from "which unit is cheapest to buy?" to "which is cheapest to own per mile over its life?" A slightly pricier vehicle that uses less fuel, needs fewer repairs and holds resale often wins — a case you can only make with per-vehicle cost data.
How does HVI help model fleet TCO?
HVI captures fuel, maintenance, downtime and service history per vehicle and department, then trends cost per mile by age — turning whole-life cost into a live report for procurement, replacement and budget decisions. It's a cost-tracking and reporting layer, not a procurement-approval or forecasting guarantee.
Put a whole-life cost on every vehicle in your fleet
Track acquisition, fuel, maintenance and downtime per unit, trend cost per mile by age, and walk into procurement and budget season with the number that actually decides value. Live in weeks, not quarters.
No credit card · Cost by vehicle and department · Built for public fleet procurement