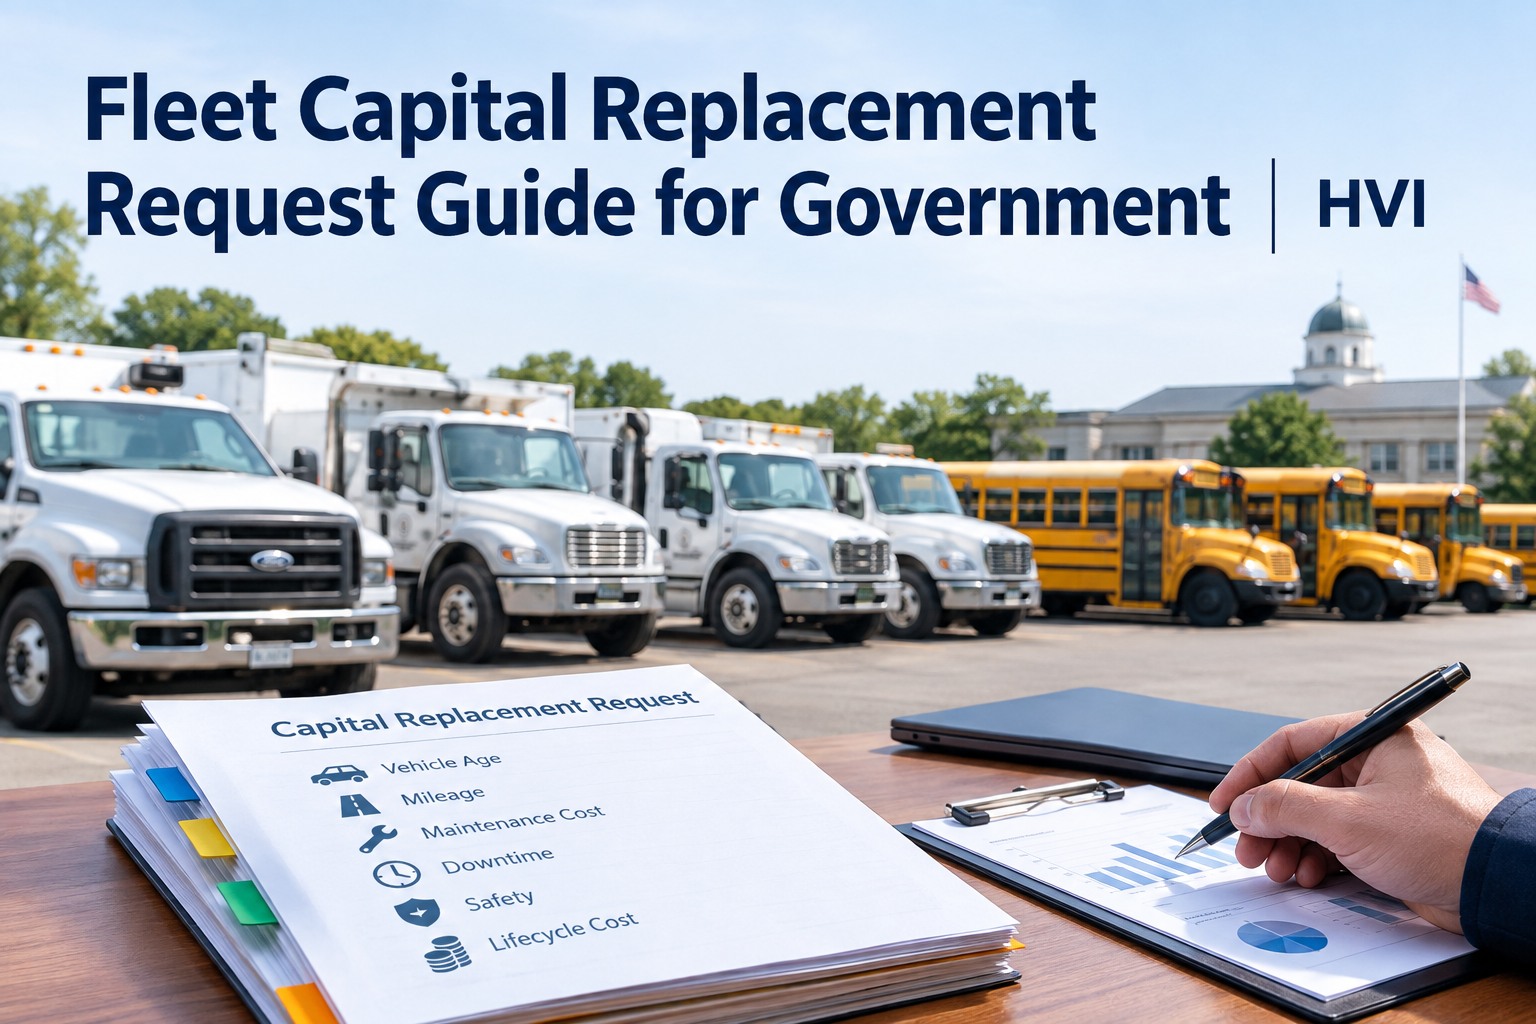
Budget season arrives with money for eight vehicles, and thirty that could reasonably go. The old way is a gut call plus whoever complained loudest — then you defend it to a council asking why unit 212 and not unit 305. A fleet replacement scoring model ends that: every vehicle gets a number from the same criteria, the list ranks itself, and the eight you replace are the eight on top. This guide shows how to build one and where the data comes from. Book a demo of replacement scoring.
A Fleet Replacement Scoring Model Turns Thirty Gut Calls Into One Ranked List
Score every unit on the same criteria, weight what matters, and the replacement order stops being an argument. Here's the formula — and the data that feeds it.
Same six criteria, every unit. The highest scores rise to the top of the replacement list — automatically.
A fleet replacement scoring model is simple in principle: pick the criteria that make a vehicle a replacement candidate, decide how much each one matters, score every unit the same way, and rank by the total. The hard part was never the math — it was getting clean, current data for thirty or three hundred vehicles without spending a month in spreadsheets. That is the part that changes when the numbers already live in one system.
The six criteriawhat a fleet replacement scoring model weighs, and why
Most public-sector models trace back to the APWA point system: six factors, each weighted, summed to one score. The weights below are a common starting point — tune them to your fleet, but keep cost and usage heavy, because that's where the real money leaks.
Repair cost per mile over the last 12 months. The clearest signal a unit is past its economical life. HVI source: maintenance cost tracking
Years since in-service date. A proxy for wear, parts availability and emissions standing. HVI source: vehicle age data
Life-to-date miles or engine hours. The true measure of accumulated work, not calendar age. HVI source: meter & mileage data
Breakdown frequency and repeat defects — the unit that keeps coming back off the road. HVI source: defect & work-order history
A technician's inspection rating of body, drivetrain and structure. The human eye the numbers miss. HVI source: inspection condition score
How hard the duty cycle is — a plow truck ages faster than a pool sedan at the same mileage. HVI source: utilization reporting
The point of weighting is honesty: a ten-year-old sedan that barely runs errands shouldn't outrank a five-year-old plow truck bleeding repair dollars. Book a demo to set your own weights. This is a ranking model for the whole fleet — distinct from a single-vehicle keep-or-replace call, which our replace-vs-refurbish lifecycle guide covers.
Before you can scorethe data each vehicle needs on file
A scoring model is only as trustworthy as its inputs — a missing repair cost or a stale odometer quietly ranks the wrong unit for replacement. Run this checklist on each vehicle before you score it. In HVI, most of these boxes fill themselves from everyday inspection and maintenance activity.
Identity & age
- In-service date on record
- Asset ID, class and service type tagged
- Expected replacement cycle for the class
Usage data
- Current odometer or engine hours
- Miles / hours over the last 12 months
- Duty-cycle severity noted
Cost & reliability
- 12-month maintenance & repair spend
- Repair cost per mile calculated
- Breakdown / repeat-defect count
Condition
- Recent inspection condition rating
- Open defects and their severity
- Any safety or structural flags
Gather these once and the score is a calculation, not an investigation. Sign up free and start filling the data per unit.
A worked rankingthree units, one fleet replacement scoring model, a clear order
Here's the model doing its job. Three vehicles, each scored 0–100 on the weighted criteria, where a higher score means a stronger case to replace. The ranking writes itself — and so does the budget conversation.
| Unit | Age | Mileage | M&R cost | Reliability | Condition | Score | Verdict |
|---|---|---|---|---|---|---|---|
| 212 — plow truck | 11 yr | High | $0.34/mi | Poor | Fair | 83 | Replace now |
| 305 — dump truck | 7 yr | Med | $0.19/mi | Fair | Good | 54 | Watch |
| 118 — pool sedan | 9 yr | Low | $0.08/mi | Good | Good | 29 | Keep |
Notice the sedan is older than the dump truck but scores lowest — because it barely works and costs little to run. That's the model protecting you from the "it's the oldest, replace it" reflex that wastes capital. Book a demo to score your own units.
The ranked fleetscores sorted against the budget cut-line
This is where the model earns its keep at budget time: the whole fleet ranked by score, with a line drawn where the money runs out. Everything above the line is this year's replacement list — defensible, because every unit was judged the same way.
- 212 · plow truck83
- 447 · refuse packer79
- 109 · aerial bucket71
- Budget cut-line · 8 units funded
- 305 · dump truck54
- 118 · pool sedan29
Next year, 305 rises as its repair costs climb — the model re-ranks itself every time the underlying data changes. No annual rebuild.
Because the inputs come straight from fleet analytics and reporting, the ranking is live year-round, not a snapshot you assemble each spring. Book a demo to see your fleet ranked against a budget line.
From a fleet director who had to defend the list
The council didn't care how I felt about a truck — they wanted to know why this one and not that one, and "it's old" never survived the question. Once every unit carried a score built from the same six things, the argument ended. I could show them the plow truck outscored the sedan even though the sedan was older, and the repair-cost line made the case for me. Budget approval went from a fight to a formality. The model didn't just pick the trucks — it defended the pick.
Fleet replacement scoring model — quick answers
What is a fleet replacement scoring model?
It's a weighted point system that scores every vehicle on the same criteria — typically age, mileage, maintenance cost, reliability, condition and usage — and ranks the fleet by total. The highest scores become the replacement priorities, so capital goes to the units that need it most, not the loudest complaint.
What criteria should the model include?
The common six are age, life-to-date mileage or hours, maintenance and repair cost, reliability, physical condition and usage/service type. Most public-sector models weight cost and usage heavily because that's where the real money is. You can tune the weights, but keep every vehicle scored on the same set.
Should the oldest vehicle always score highest?
No — that's exactly the reflex a scoring model protects against. A low-mileage sedan that rarely runs can be older than a plow truck yet score far lower, because it costs little to keep. Weighting cost, usage and reliability stops age alone from driving the list.
How often should we re-run the scores?
At minimum annually for the capital budget, but the real value is a model that updates continuously as mileage and repair costs change. When the inputs are live, you can re-rank anytime a council member asks — rather than rebuilding a spreadsheet each budget cycle.
How does HVI support a replacement scoring model?
HVI already tracks the inputs the model needs — maintenance cost, mileage and meter data, inspection condition and reliability history — and surfaces them in reporting. It gives you clean, current data to score and rank from; it doesn't set your weights or make the capital decision for you.
Build a fleet replacement scoring model on data you already have
HVI turns the maintenance cost, mileage, condition and reliability your fleet already generates into a live, defensible replacement ranking — so budget season is a sorted list, not a spreadsheet marathon and a fight at council. Live across your fleet in under two weeks.
No credit card · No hardware · Scoring inputs tracked from day one