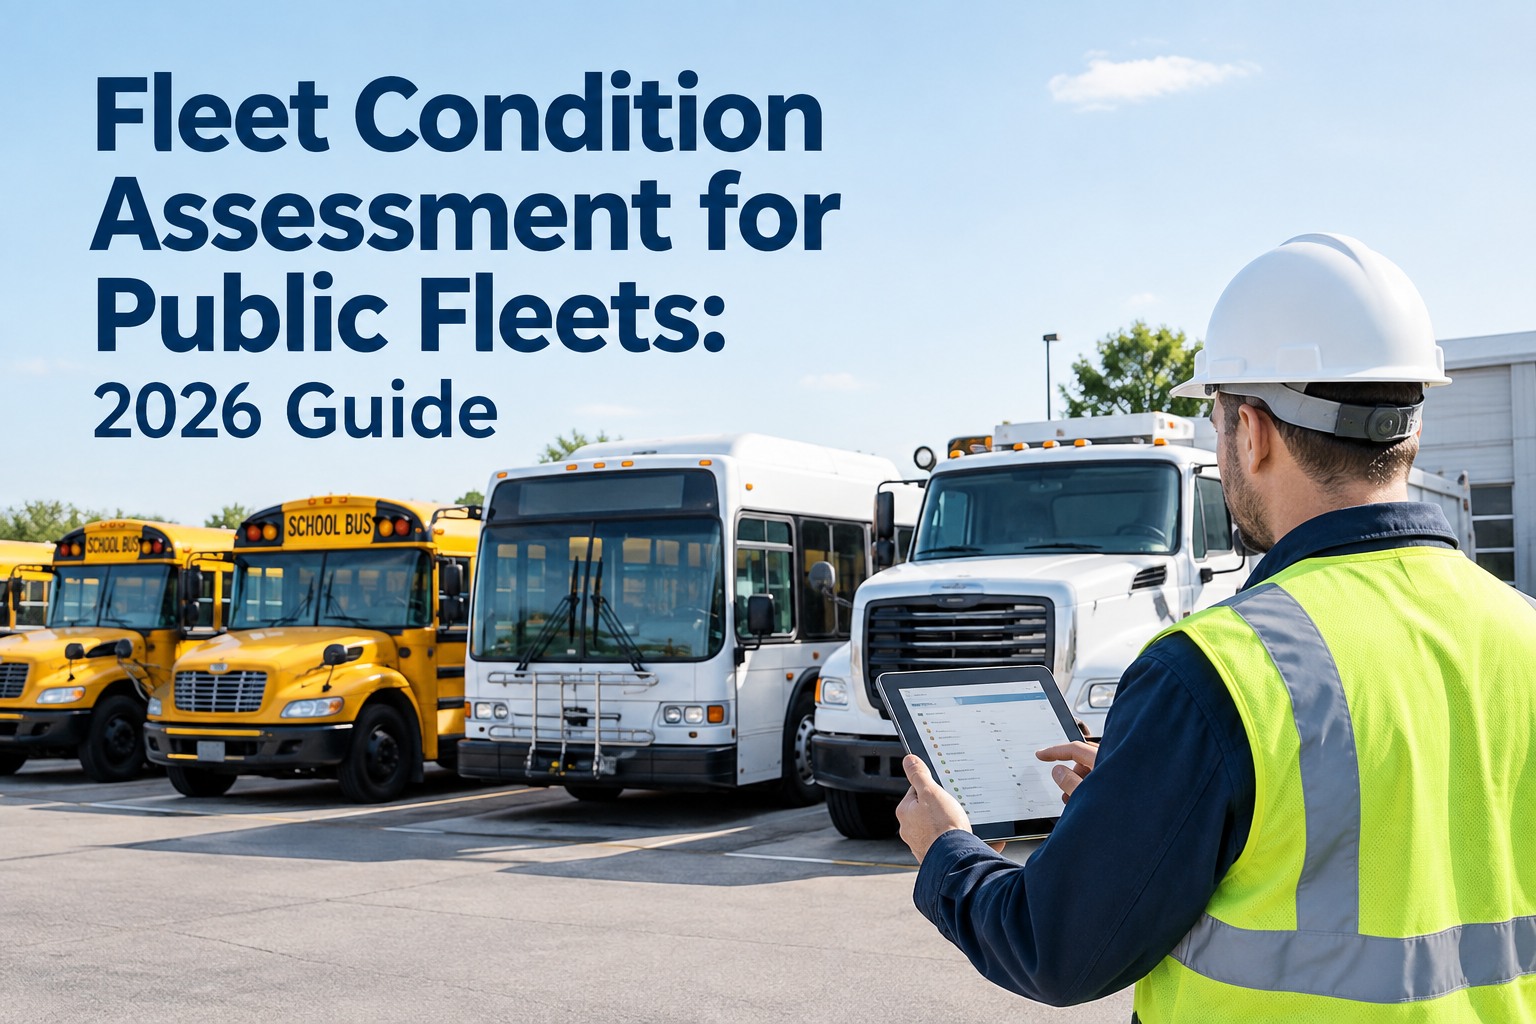
Every fleet director knows which trucks are worn out. The hard part is proving it to the people who hold the budget. "Unit 4712 feels tired" doesn't win a capital request — a documented condition score, backed by dated photos and a repair-cost line that's climbing past the truck's value, does. That's what a fleet condition assessment is for: turning the thing you already know into objective evidence a finance officer and a council can act on. See condition scores, photos and cost trends per asset
Turn "That Truck Is Worn Out" Into a Number Finance Can't Argue With
A condition assessment scores each system on a consistent 1–5 scale. Tap a system to see what it rates — and what each score really means.
Frame, chassis, mounts, and rust. Heavy corrosion is often the score that ends a vehicle's life — a 4 or 5 here means structural repairs that rarely pay back on an old unit.
Evidence: dated photos of frame & rustEngine, transmission, drivetrain condition and reliability. Backed by the maintenance history — repeated major repairs push this score up and the vehicle toward replacement.
Evidence: repair history & cost trendBody, cab, interior, and the working gear that makes the unit useful — the plow, the lift, the tank. A worn body is cosmetic; failing working equipment takes the unit out of service.
Evidence: dated photos of body & equipmentBrakes, lights, steering, restraints — the systems that decide whether the unit is safe to keep in service at all. A poor score here can force replacement regardless of the rest.
Evidence: inspection results per systemThe composite score, weighted across every system. This is the single figure that goes on the capital request — and, trended year over year, the line that shows a vehicle sliding toward the end.
Evidence: the exportable condition reportAn annual condition assessment gives finance a consistent, objective basis for judging aging assets — and gives you the evidence to back a replacement before a truck fails on a snow route or a refuse run. Below is how it's structured, why the cost line matters most, and how a year-over-year trend turns a snapshot into a case.
What a condition assessment actually scores
A good assessment isn't one gut-feel rating — it's a set of defined scores across the systems that decide a vehicle's usable life, each rated on the same scale so any assessor lands in the same place. Five scored areas roll up into one defensible number.
Structure & corrosion
Frame, chassis, mounts, rust-through. The quiet vehicle-killer — and the one photos make undeniable.
Powertrain
Engine, transmission, drivetrain — condition scored against the repair history behind it.
Body & working equipment
Cab, body, and the plow/lift/tank that makes the unit do its job.
Safety systems
Brakes, lights, steering, restraints — a poor score can force replacement on its own.
Overall condition
The weighted composite — the one number that goes on the request.
The power is in consistency: when every assessor uses the same defined scale, a score means the same thing across the fleet and across the years. That's what a configurable, standardised assessment template gives you — not five people's opinions, one repeatable measure. Book a demo to see configurable condition-assessment templates.
The cost line that wins the budget meeting
Condition scores get a vehicle noticed. One number gets it approved: the ratio of lifetime maintenance cost to what the vehicle is worth. When repair spend climbs past 60–70% of replacement value, keeping the truck stops being thrift and starts being waste — and that's math a council can't wave away.
Illustrative curve — past ~60–70%, replacement is defensible on straight cost math.
This is the single most powerful line in a capital request because it converts subjective condition into objective cost. Pair the rising ratio with the condition score and the photos, and the case makes itself — but only if the maintenance cost has been tracked per vehicle all along. Book a demo to trend maintenance cost per vehicle.
One assessment is a snapshot. Three is a trend.
A single condition score says where a vehicle is today. The same score, captured the same way three years running, shows where it's going — and a vehicle sliding from a 2 to a 4 is a far stronger replacement case than one that's simply "a 4 now." That only works if the scoring is consistent year over year.
Time the assessment just before budget season and the trend lands exactly when the capital decision is being made. Run it alongside a scheduled inspection or service and you capture it without a separate trip to the yard. Book a demo to see condition scores trended year over year.
What makes the evidence hold up
A replacement request lives or dies on whether the evidence is trustworthy. Four things turn a condition score from a claim into a record a finance officer, an auditor, or a council will accept without a fight.
Timestamped photos
Each score backed by dated images tied to the specific asset — corrosion, damage, wear you can see, not describe.
Consistent scoring standard
The same defined scale every time, so scores compare across vehicles and across years without an asterisk.
Age & utilisation data
Years in service and real usage alongside the score — condition read in the context of how hard the unit worked.
Exportable report
The whole assessment — scores, photos, cost, trend — as one report you hand to finance, not a spreadsheet you rebuild each year.
Assembled, these four turn "I think it's time to replace 4712" into a documented condition history no one has to take on faith. That documented history is exactly what strengthens a replacement request. Start free and export condition reports for budget planning.
The annual condition assessment checklist
Run this once a year, timed just before budget season, and you build the capital-planning evidence as you go. Use this condition-assessment checklist online free, so scores, photos, and cost trends attach to each asset automatically.
Score every system on one scale
Structure, powertrain, body/equipment, safety, overall — the same 1–5 scale, every vehicle.Photograph the evidence, dated
Corrosion, damage, and wear captured with a date and the asset ID on every image.Pull maintenance cost & age
Lifetime repair spend against replacement value, plus years in service and utilisation.Compare to last year's score
Trend each vehicle against its own prior assessments to show the direction, not just the point.Combine with a scheduled service
Capture the assessment during a planned inspection or PM so it costs no extra yard time.Export the report for finance
One document — scores, photos, cost, trend — ready for the capital request and the audit trail.From a fleet director who stopped losing the budget argument
For years my replacement requests were basically "trust me, these trucks are done." Finance would trim the list to whatever looked cheapest to defer, and I'd be back the next year with the same trucks, now worse. I had the knowledge but not the evidence.
We started scoring every unit the same way each year, with photos and the repair-cost ratio attached. Now I walk into the budget meeting with a condition report per vehicle — a 4 that was a 2 two years ago, rust photos, and a repair line past 60% of replacement value. The conversation changed completely. It's not my opinion against theirs anymore; it's the data.
Frequently asked questions
What is a fleet condition assessment?
It's a structured evaluation that scores each vehicle's condition on a consistent scale — typically covering structure and corrosion, powertrain, body and working equipment, safety systems, and an overall composite. Backed by dated photos, maintenance history, and cost data, it turns a subjective "this truck is worn out" into objective evidence. Public fleets run it annually to give finance a consistent basis for evaluating aging assets and to support vehicle-replacement decisions with documented condition rather than anecdote.
How is fleet condition scored?
Most public fleets use a defined scale — commonly 1 to 5, where 1 is excellent (no significant wear, mechanically sound) and 5 is end-of-life (severe wear, near the end of useful service). Each system is scored against that scale, and the individual scores roll up into an overall condition rating. The key is consistency: when every assessor applies the same defined scale, scores mean the same thing across the whole fleet and can be compared year over year.
When should a public fleet run its condition assessment?
Time it just before budget season so the results feed directly into the capital-planning and replacement discussion while they're current. Running it annually on the same schedule also keeps the scoring consistent for year-over-year trending. Many fleets capture the assessment during a scheduled inspection or preventive-maintenance service, so the condition data is collected without a separate trip to the yard and without extra downtime.
How does a condition assessment support a replacement request?
It converts a judgement into evidence. A documented condition score, dated photos of corrosion and wear, a maintenance-cost line climbing past 60–70% of the vehicle's replacement value, and a score trend that's worsening year over year together make a case a finance officer or council can act on. Instead of competing opinions about which trucks are "done," the decision rests on consistent data attached to each asset — which is exactly what strengthens the request.
Why not just replace vehicles by age or mileage?
Because age and mileage don't equal condition. Some vehicles get retired with years of useful life left, while others stay in service well past the point where they're economical — a light-duty admin car and a snowplow of the same age are nowhere near the same condition. Scoring actual condition, alongside age, utilisation, and repair cost, targets replacement at the vehicles that genuinely need it and avoids spending capital on units that don't.
Walk into the budget meeting with data, not a hunch
HVI runs condition assessments on configurable templates, captures timestamped photos per asset, trends maintenance cost, age, and utilisation, and exports the whole record as a report for capital planning. So every replacement request arrives as documented condition history — the kind that holds up in front of finance, a council, and an auditor.
No credit card · Timestamped photo evidence · Cost trend & exportable reports