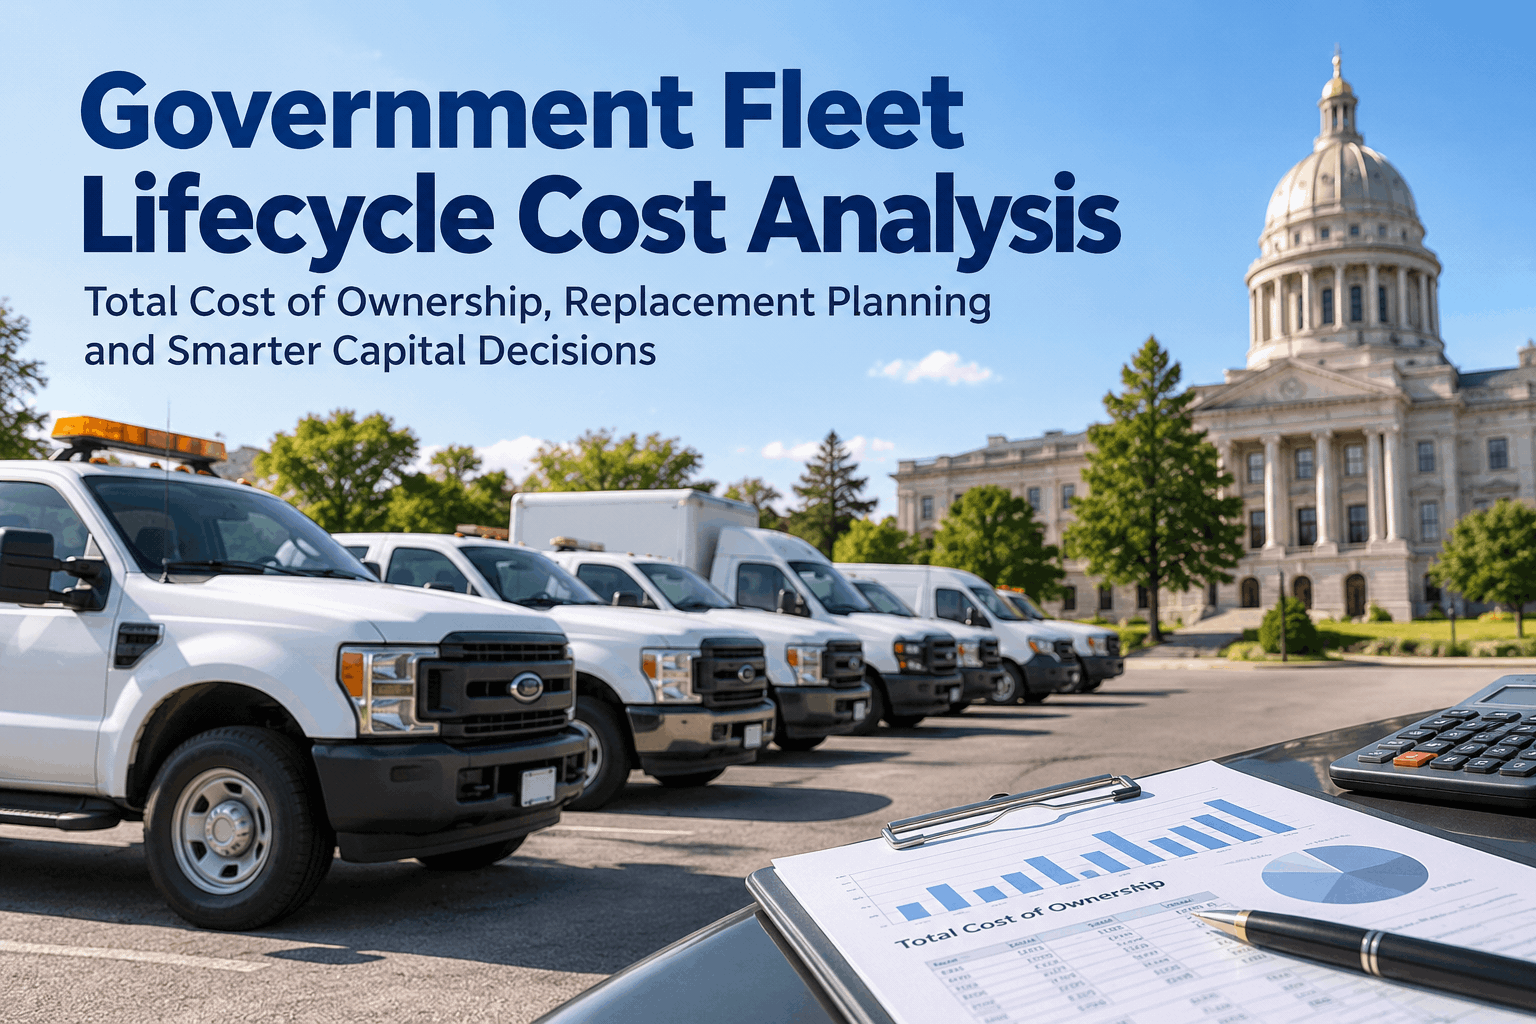
Government fleet lifecycle cost analysis helps public agencies answer a difficult budget question: when does keeping a vehicle cost more than replacing it? Purchase price is only the opening entry. Fuel, maintenance, downtime, financing, and eventual resale value can change the economics over a vehicle's service life. This guide gives fleet directors and finance officers a practical total cost of ownership (TCO) formula, an illustrative municipal truck example, and a repeatable method for presenting replacement decisions. Book a demo to explore HVI fleet cost reporting.
Government Fleet Lifecycle Cost Analysis: From Purchase Price to Replacement Decision
A defensible replacement budget starts with one question: what does this asset cost the public to own and operate, year after year?
What belongs in a government fleet lifecycle cost model?
A credible fleet lifecycle cost model combines the capital expense of acquiring an asset with the cost of operating it until disposal. It should reflect how the agency actually uses the vehicle, not just the manufacturer or model year.
For financial comparisons, use the same treatment of inflation, discounting, taxes, overhead allocation, and financing across all candidates. Do not mix nominal and present-value dollars.
Acquisition
Vehicle purchase, upfitting, delivery, initial commissioning and other capitalized costs.
Operating
Fuel or electricity, fluids, routine consumables, and usage-linked operating expenses.
Maintenance
Preventive maintenance, corrective repairs, labor, parts, tires, and contracted service.
Other and disposal
Insurance, licenses, financing and allocated costs, less expected sale or salvage proceeds.
Agencies may also evaluate service interruption and replacement rentals. Keep these in a clearly defined cost category to avoid double counting. Book a demo to review maintenance-cost records in HVI as an input to the model.
Municipal truck lifecycle cost calculation
Consider a hypothetical public works truck retained for eight years and driven 96,000 miles. The values below illustrate the calculation; they are not industry averages or quoted HVI customer results.
The calculation assumes these are comparable, undiscounted dollar amounts. A formal capital appraisal may use net present value instead.
Cost per mile is useful when comparing vehicles with similar duty cycles. For generators, loaders, sweepers, or low-mileage specialty assets, cost per engine hour or cost per operating day may be more meaningful. Always compare like-for-like equipment and service requirements.
Why the cheapest vehicle to buy may not be the cheapest to keep
Depreciation and repair exposure tend to behave differently as a vehicle ages. The useful decision point is not a fixed age; it is when the expected future cost and risk of retention become less attractive than a properly specified replacement.
Would another year of ownership save enough capital to offset the additional expected repairs, fuel consumption, downtime, and loss in residual value? Evaluate the next year forward—not only money already spent.
See the maintenance-cost inputs behind your replacement decisions
Explore how HVI work orders, asset records and maintenance reporting can support a more defensible fleet cost review.
Keep, replace, or investigate: a public fleet decision matrix
Lifecycle cost is a strong input, but government replacement decisions also depend on service criticality, safety, funding restrictions, and procurement lead times. Use a documented matrix rather than a single age cutoff.
These are decision examples, not automated HVI replacement recommendations. A safety defect requires appropriate immediate action regardless of financial scoring.
Retention scenario
Estimate next-year maintenance, fuel, downtime exposure, residual-value decline and major component risk.
Replacement scenario
Estimate purchase and upfit, expected operating costs, useful life, financing assumptions and disposal proceeds.
Service scenario
Assess availability, replacement vehicle suitability, route or duty requirements, and procurement lead time.
Build a five-year municipal fleet replacement forecast
Finance officers need more than a list of aging vehicles. A useful forecast translates asset-level decisions into annual capital requests, replacement timing, and the operational consequences of deferral.
Inventory assets. Record vehicle class, purchase date, acquisition cost, usage, condition, and intended service life.
Normalize spending. Assign fuel, work-order labor, parts, outside repairs, and other costs consistently.
Forecast retention. Estimate near-term repairs, expected use, downtime exposure, and remaining value.
Test alternatives. Compare replacement, refurbishment, redeployment, shared use, or reduced fleet size.
Present the budget. Show assumptions, priority tiers, funding year, and the cost of deferring each request.
A replacement score can help prioritize assets, but it should not substitute for a full cost model. If your agency already uses a weighted replacement score, pair it with forward-looking TCO and funding scenarios. Book a demo to discuss fleet maintenance reporting for capital planning.
Where lifecycle cost models go wrong
The biggest risk is not complicated math. It is inconsistent records. A model built from incomplete repair histories or incomparable duty cycles can produce a very precise but misleading ranking.
A high-hour plow truck and a lightly used administrative sedan should not share the same cost-per-mile expectation.
Parts-only repair cost understates the burden on the shop. Use a consistent loaded labor-rate policy.
If rental replacement cost is included, do not add the same disruption again as a separate cash expense.
Past spending is history. Replacement choices depend on expected future costs and service value.
Duty cycle, corrosion, hours, mileage, residual value, and mission criticality vary across fleets.
Use consistent treatment of inflation and discounting when comparing multi-year alternatives.
How HVI supports the evidence behind fleet lifecycle costing
HVI is a fleet maintenance and inspection platform, not a substitute for a government's finance or procurement system. Its value in this process is helping teams maintain the operational records needed for better cost analysis.
Condition and defects
Use documented inspection findings to understand recurring issues and asset condition.
Repair history
Review corrective work and service events associated with each asset.
Service patterns
See whether scheduled upkeep is being performed and where maintenance is becoming reactive.
Cost review inputs
Use available maintenance and fleet reporting data to inform your external lifecycle model.
Verify which report fields and export options are available for your HVI account during a product walkthrough. Acquisition, depreciation, financing, grant accounting, and formal capital approval may still need to be maintained in separate financial systems. Sign up free to begin organizing fleet maintenance records in HVI.
Before your next fleet budget meeting
Use this compact checklist to test whether each replacement recommendation can withstand questions from finance, elected officials, and operations leadership.
Make fleet replacement discussions evidence-led
See how HVI helps organize maintenance activity, work orders, and reporting inputs so your team can build stronger government fleet lifecycle cost analyses.
Government fleet lifecycle cost analysis FAQs
What is government fleet lifecycle cost analysis?
It is the process of estimating all relevant costs of acquiring, operating, maintaining, and disposing of a public fleet asset over its useful life. Agencies use it to compare retention and replacement options and support capital budget decisions.
How do you calculate fleet total cost of ownership?
Add acquisition, fuel or energy, maintenance, and other ownership costs over the analysis period, then subtract residual or disposal value. Use consistent assumptions about inflation and discounting; formal appraisals may calculate the present value of future cash flows.
What is the best replacement age for a municipal vehicle?
There is no universal replacement age. It depends on vehicle class, duty cycle, maintenance trend, safety, downtime, procurement constraints, and residual value. Compare the expected cost of keeping the current vehicle with the cost and service value of replacing it.
Should government fleets compare cost per mile or cost per hour?
Use the denominator that best reflects the asset's work. Miles can suit road vehicles; engine hours can be more informative for equipment that idles or performs stationary work. Avoid comparing different classes without accounting for mission and utilization.
Can HVI calculate government fleet lifecycle cost automatically?
HVI supports fleet maintenance, asset records, work orders, and reporting inputs that can inform lifecycle cost analysis. A complete public-sector TCO model may also require acquisition costs, depreciation, financing, grants, and disposal values from other systems. Confirm specific reports and export capabilities in a demo.