Picture a council budget hearing. Someone projects two numbers: the sticker price of a new pickup, and the "savings" of running the twelve-year-old one another year.
The old truck wins on paper. No payment, low book value, looks free. Nobody in the room can see the four shop visits last quarter, or the two days a crew sat idle waiting on a part.
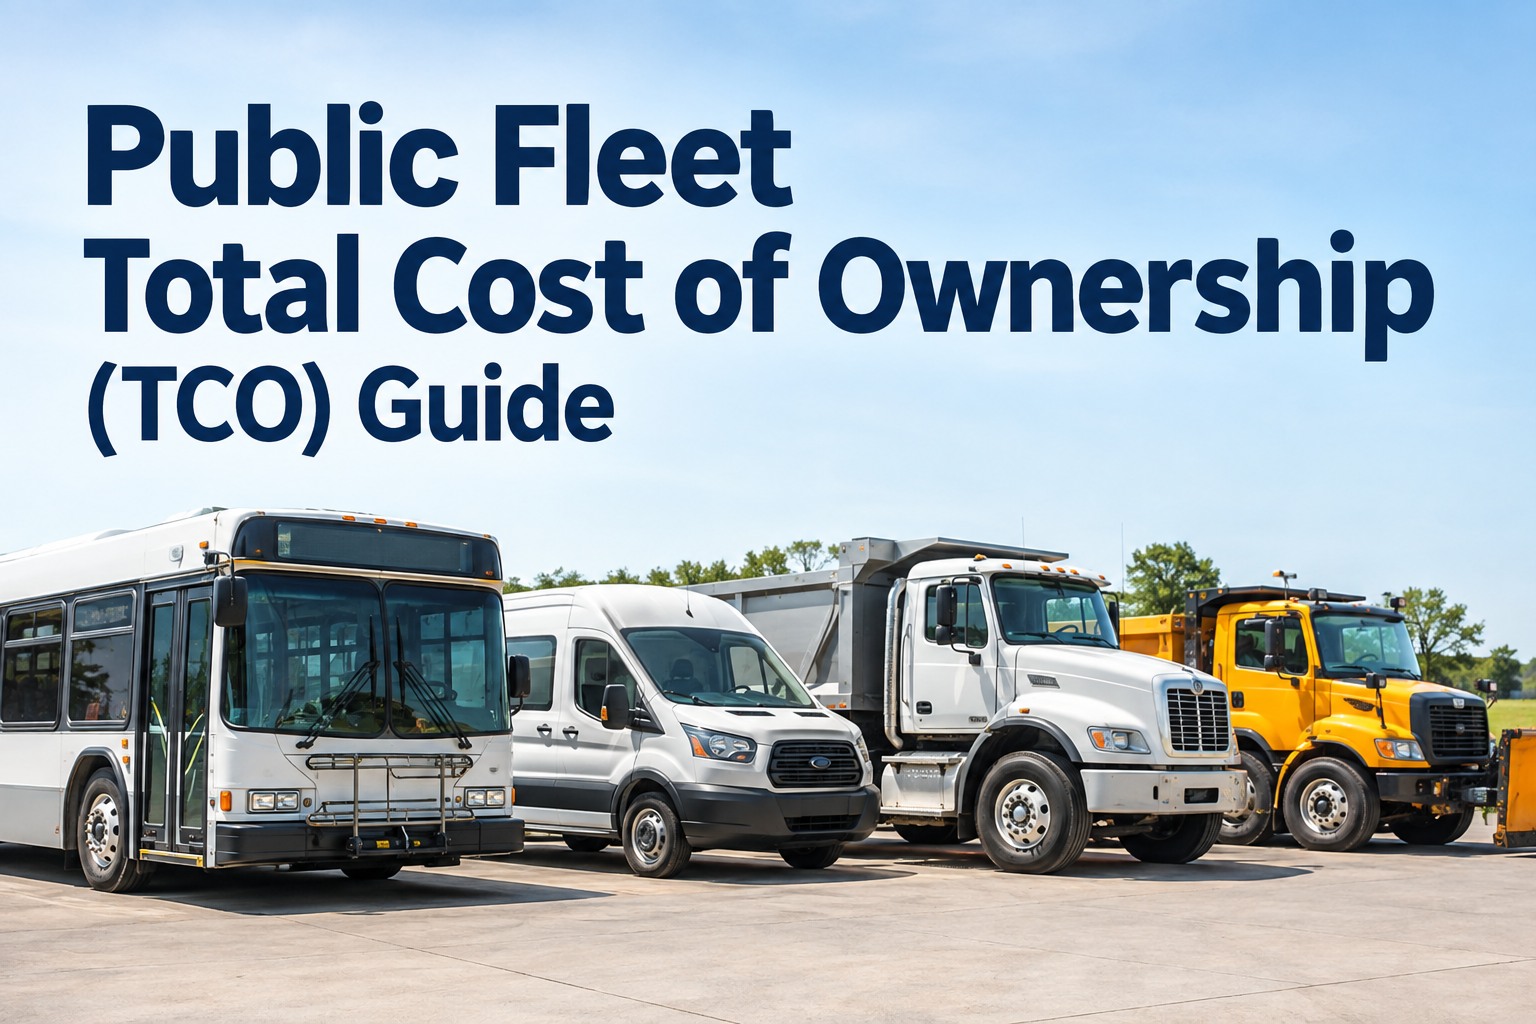
That blind spot is exactly what public fleet total cost of ownership is built to close. It's the real cost of keeping a vehicle in service, not just what it cost to buy it.
For a fleet director or procurement officer, cheapest to buy and cheapest to own are almost never the same vehicle. Book a demo to see vehicle-level cost history in action
Three numbers, one message. Public fleets already look efficient on paper. The real question is whether that efficiency is hiding a cost somewhere else in the ledger.
What Public Fleet Total Cost of Ownership Actually Measures
Total cost of ownership adds up everything a vehicle costs from the day it's ordered to the day it's sold or scrapped. Not just the purchase order line.
Government fleets often average a lower TCO per asset than the fleet-wide average shown above. That looks like good news at first glance.
It usually means something else. Public fleets tend to hold vehicles longer and run leaner maintenance staffing, which hides cost per mile while quietly raising downtime and risk elsewhere.
A complete model has to account for every category below. Leave one out and the number you bring to finance won't survive questioning.
Think of it less as an accounting exercise and more as a diagnostic tool. Each category is a place a vehicle can quietly bleed money without anyone noticing until the fiscal year closes.
Acquisition & Disposal
Purchase price minus resale or auction value at end of service life. The number most RFPs stop at.
Fuel & Energy
Gasoline, diesel, or electricity, weighted by actual utilization instead of average fleet mileage.
Preventive Maintenance
Scheduled service by meter reading or calendar. Done right, it suppresses every other line on this list.
Repairs & Parts
Unscheduled failures, part cost, and outside labor. Usually the fastest-growing line as a vehicle ages.
Tyres & Wear Items
Tyres, brakes, and other wear components tracked against usage, not a fixed calendar guess.
Downtime & Service Impact
Crew hours lost, rental backfill, delayed service calls while a unit sits waiting on a bay or a part.
Insurance, licensing, and internal labor belong on this list too. How they're allocated varies by agency accounting practice, so check with your finance office before publishing a model externally.
Notice what's missing: brand loyalty, a driver's preference for a make, how a truck looked on the lot. None of that belongs in the model, though it often sways decisions anyway, informally, unless the numbers are on the table to counter it.
Take a mid-size utility truck used by a public works crew. Fuel and scheduled service might run predictably for the first three years.
Then a transmission repair, two tow calls, and a week of downtime show up in year four, all in different accounts on the ledger.
A TCO model is what ties those three events back to one vehicle, one decision, and one line on next year's budget request.
Why Purchase Price Alone Misleads Public Fleet Replacement Decisions
The lowest bid on a solicitation and the lowest total cost of ownership are frequently two different vehicles.
A higher-priced unit with fewer repairs, better parts availability, or stronger resale value can beat a cheaper competitor over a five- or seven-year hold. Evaluating on price alone rewards the number that's easiest to compare, not the one that's cheapest to live with.
An old truck, no payment left
Zero remaining loan balance, low book value, sits on the asset register looking like the cheapest unit in the yard.
The same truck, invoicing differently
More repair bills, more downtime, more technician hours than a replacement would cost in monthly payments.
That truck isn't free to keep. It's just billing the agency through a different line item. Book a demo to pull real repair-frequency trends per unit
| Cost Category | Lowest Bid Vehicle | TCO-Evaluated Vehicle |
|---|---|---|
| Acquisition price | Lower | Higher |
| Repair frequency, years 3–7 | Rises sharply | Gradual, predictable |
| Downtime / service impact | Higher, uneven | Lower, planned around PM |
| Parts availability | Often OEM-limited | Broader aftermarket support |
| Resale / disposal value | Weaker | Stronger |
| 7-year total cost | Frequently higher | Frequently lower |
This is a framework for the comparison, not a guaranteed outcome. Actual results depend on make, model, duty cycle, and how closely preventive maintenance gets followed.
A Ford or Freightliner pickup used for light utility work behaves very differently from a Kenworth or Peterbilt vocational truck running a refuse route. The TCO framework is the same, but the specific cost drivers and replacement timing will not be.
There's a political side to this too. An award that goes to a higher sticker price on the strength of a TCO argument has to be explainable to someone who wasn't in the room.
"This model costs less to keep on the road over seven years, and here's the repair history" is a sentence that holds up in public. "Trust the spreadsheet" is not.
Build the model, but also build the one-paragraph version that survives being read aloud at a public meeting. Both documents come from the same numbers.
Building a Defensible TCO Model for Council and Finance Review
A model that survives a finance committee's questions comes from the agency's own vehicle history, not a generic industry multiplier.
NAFA Fleet Management Association members alone manage roughly 1.4 million vehicles worth close to $45 billion. At that scale, documented vehicle-level data beats a rule-of-thumb depreciation curve every time it's put in front of a budget committee.
Most of the raw material for this already exists somewhere in the agency. Work orders, fuel logs, part invoices, and technician time sheets just need to be tied back to individual vehicles instead of sitting in separate systems.
Holding periods vary widely by asset type. Light sedans and pickups are often cycled every five to seven years, while specialty equipment like street sweepers or fire apparatus can run fifteen years or more. The model needs a holding-period assumption for each class, not one number for the whole fleet.
-
1
Pull vehicle-level cost history
Acquisition cost, every work order, every part, every labor hour tied to the specific unit. Not a fleet-wide average.
-
2
Normalize by utilization and holding period
Cost per mile or per hour, not cost per year, so a low-use unit doesn't look artificially efficient.
-
3
Add downtime and service-impact cost
Crew hours lost and backfill cost while a vehicle is out of service. The line most spreadsheets skip entirely.
-
4
Compare specs on an equal basis
Same duty cycle, same holding-period assumption, so two bids are actually measured against each other fairly.
-
5
Package it for the audience reviewing it
Council wants the bottom line and the risk. Finance wants the fiscal-year breakdown. Build both from one dataset.
Whether lifecycle-cost criteria can formally factor into a bid award depends on your jurisdiction's procurement code and the specific solicitation. Confirm with your procurement office before writing TCO scoring into an RFP.
Start free and centralize this data across departments so next cycle's model builds itself from records you already have.
Decide who owns updating the model once it's built. A framework that lives in one analyst's spreadsheet decays the moment that person changes roles.
Assign the update cadence to a role, not a person. Quarterly for high-utilization units like refuse trucks or patrol vehicles, annually for lower-use specialty equipment. Book a demo to see how that reporting cadence works in practice
From a fleet director who's presented this to council more than once
Every year someone asks why we're replacing a truck that "still runs." I stopped arguing that point out loud and started bringing the cost sheet instead.
Repair count, downtime days, parts spend, side by side with the lease quote. Once the number is in front of them instead of in my head, the conversation gets a lot shorter.
What Procurement Teams Often Miss in Public Fleet TCO Models
Even careful models leave gaps. Here are the four that show up most often once a fleet team starts digging into their own numbers.
Downtime hides on no ledger
A vehicle sitting in the shop doesn't show up as a cost anywhere. The crew waiting on it absolutely is one.
Insurance and licensing don't transfer
Costs vary enough by jurisdiction and vehicle class that a model built for vans won't fit a dump-truck fleet without adjustment.
Fuel type shifts the winner
Electric and alternative-fuel units are increasingly favored under a TCO framework once lower energy and maintenance costs are counted over a multi-year hold, per Electrification Coalition case studies of municipal fleets.
Department silos bury the pattern
The same shop can maintain three departments' vehicles under three separate budget lines, letting one recurring mistake repeat itself unnoticed.
Resist applying one universal age-based depreciation percentage across every vehicle class. A utility truck, a patrol sedan, and a light pickup age and fail differently.
The model should reflect each asset's own repair and downtime history, not a formula borrowed from a different fleet type. Book a demo to model cost per vehicle across fuel types and departments
Public Fleet Total Cost of Ownership Is the Number That Protects the Budget
None of this requires new software licenses for every department or a multi-year data project. It requires deciding that vehicle cost gets tracked at the vehicle level from now on, and sticking with it.
Purchase price tells you what a vehicle costs to bring into the fleet. Public fleet total cost of ownership tells you what it costs to keep it there.
Fuel, maintenance, repairs, downtime, and everything else that shows up on a dozen invoices instead of one line. Building that model from vehicle-level history, not fleet-wide averages, turns a replacement request into a case a council can actually approve.
Start free and let the data build itself before the next budget cycle catches you rebuilding the spreadsheet from memory.
Frequently Asked Questions
What is included in public fleet total cost of ownership?
Public fleet total cost of ownership includes acquisition cost minus disposal value, fuel or energy, preventive maintenance, unscheduled repairs and parts, tyres and other wear items, labor, downtime and service impact, and insurance or licensing costs where applicable.
A complete model tracks these per vehicle over its full holding period rather than as a fleet-wide average, since duty cycle and operating environment change how each category behaves.
Why does purchase price alone not reflect a vehicle's real cost?
Purchase price only captures the acquisition line. It doesn't reflect repair frequency, downtime, parts availability, or resale value, all of which can vary significantly between two vehicles with similar sticker prices.
A lower-priced unit that needs more frequent repairs can cost more over five to seven years than a higher-priced alternative with a lower total cost of ownership.
How do public fleets calculate cost per vehicle for TCO?
Cost per vehicle sums acquisition cost, fuel, maintenance, repairs, parts, labor, and downtime-related costs for a specific unit over a defined period, then divides by miles or hours of utilization.
Tracking this at the individual vehicle level, instead of a fleet-wide average, makes it possible to compare replacement candidates fairly and spot units whose costs are rising faster than their peers.
Can procurement rules require evaluating bids on total cost of ownership instead of price?
Whether lifecycle-cost criteria can be built into a bid evaluation depends on the jurisdiction's procurement code and the specific solicitation language.
Some frameworks allow best-value scoring that includes lifecycle cost, while others require award to the lowest responsive bid on price alone. Confirm the applicable rules with your procurement office before writing TCO criteria into an RFP.
How does downtime factor into total cost of ownership for government fleets?
Downtime adds cost that doesn't appear on a maintenance invoice: crew hours spent waiting, backfill equipment brought in, and delayed public service while a unit is out.
Because it isn't itemized the way parts or labor are, downtime is one of the most commonly underweighted categories in public fleet TCO models, even though it can change which vehicle is actually the lower-cost option.