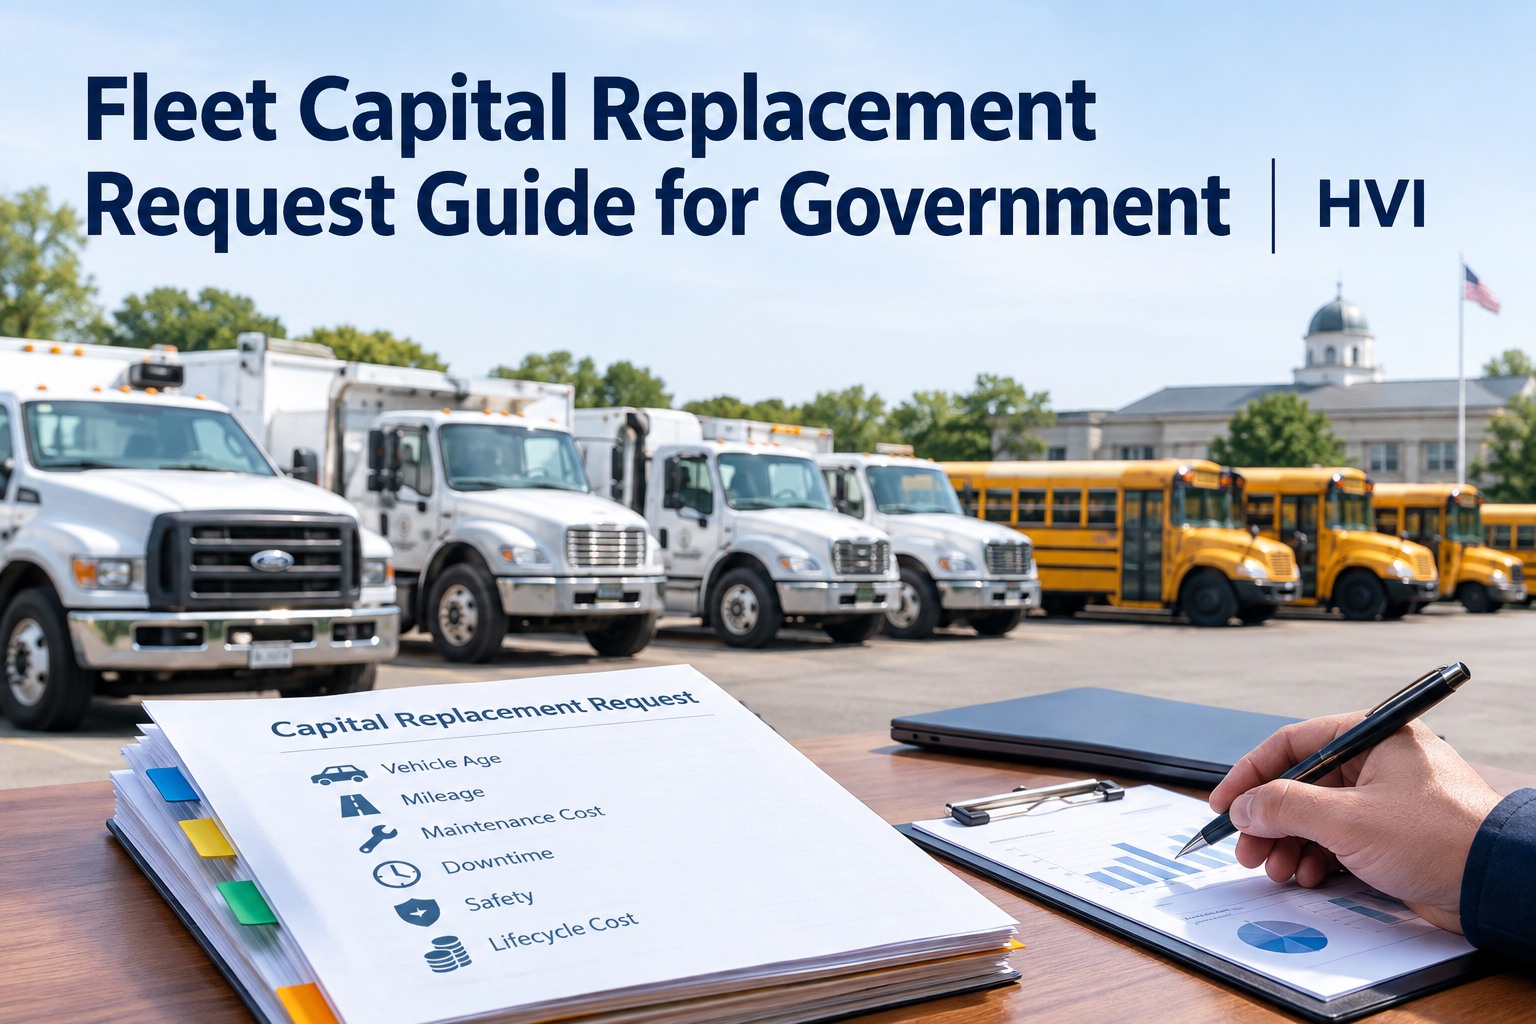
You know the snowplow is done — fourteen years old, in the shop more than on the road, dead mid-route last winter. But "it's old and it breaks" doesn't survive a budget meeting, so the plow stays another season. A municipal fleet replacement policy turns that gut call into a number the council can't wave off. Book a demo to see lifecycle scoring on your fleet.
Turn "It's Old and It Breaks" Into a Score the Council Can't Argue With
A replacement policy scores every unit against the same measurable factors, so the decision is a ranked number — not a hunch you have to defend on the spot.
A municipal fleet replacement policy is the written framework that decides which vehicles get replaced, when, and in what order — using consistent, measurable criteria instead of the loudest complaint or the squeakiest wheel. Done well, it does two jobs at once: it lands your capital dollars on the units that actually need them, and it hands you the paper trail to defend every request to finance, council and auditors. This guide walks through why age-only rules fail, how to build a scoring framework, where the real replacement triggers sit, and how to prioritise when the budget won't cover everything.
Not just agewhy "8 years / 100,000 miles" quietly costs you money
The simplest replacement rule — a fixed age or mileage cutoff like eight years or 100,000 miles — is objective and easy to explain, which is exactly why so many agencies use it. But it has one fatal flaw: it treats every vehicle in a class as identical, when a garaged admin sedan and a pothole-pounding utility truck of the same age are nothing alike.
"Replace at 8 years or 100k miles, whichever comes first."
Retires healthy, low-use units too early — and keeps high-repair units running because they're "not old enough yet." You pay both ways."Reach the age or mileage target and you become a candidate — then condition, cost and downtime decide."
Replaces the units that actually cost you money, keeps the ones with life left, and ranks the rest. Every dollar lands where it works hardest.The best-practice approach treats age and mileage as the trigger that makes a unit a candidate for review — not an automatic replacement. Research consistently shows vehicle age often drives maintenance cost per mile more than mileage does, and the lowest-mileage vehicle is frequently not the lowest-cost one to keep. That's the whole case for a scoring model over a calendar. Book a demo to see age, mileage and cost scored together per unit
The scoring modelhow a point-based replacement framework works
Most defensible municipal fleet replacement policies come down to a point system. Real examples exist in the wild — the City of North Salt Lake runs a published 15-point framework — and they all share the same logic: score each vehicle against a handful of measurable factors, add the points, and rank the fleet. Here are the five criteria that carry the weight.
Age
Points scored against a target life for the vehicle class — commonly one point per fifth of target age. Corrosion and component aging matter most for low-mileage units that rack up years without miles.
Mileage or hours
Scored against expected lifecycle usage. Critically, some classes must use hours, not miles — a snowplow or a loader lives by engine-hours, and mileage badly understates its real wear.
Maintenance cost
The heaviest-hitting factor. Scored against the vehicle's value and its class average — a unit whose repairs run well above its peers is signalling the end of its economic life, whatever its age.
Condition & downtime
Inspection-based condition plus how often the unit is out of service. Downtime deserves its own score because repair cost alone understates the operational hit of a vehicle that keeps stranding a crew.
Mission & safety
The override. A structural safety concern, failed inspection, or a unit essential to a critical service (fire, emergency, snow response) can move a vehicle up the queue regardless of its point total.
Add the points and you get a single, rankable number per vehicle — and, just as importantly, a documented rationale. The point isn't that a score fires the decision automatically; targets flag candidates, and judgement still applies. The point is that everyone from the mechanic to the finance director is looking at the same evidence. Start free and build replacement scoring from your own cost and condition records
The triggersthe cost thresholds that signal end of economic life
Underneath the scoring model sit the hard numbers that tell you a vehicle has crossed from worth-keeping to worth-replacing. These thresholds turn "feels expensive" into a defensible line. The most widely used is the 50/30/20 screen.
| Trigger | Threshold | What it means |
|---|---|---|
| Single repair | > 50% of value | Math no longer supports the repair — replace. |
| Annual maintenance | ~30% of value | Nearing end of life — plan replacement within 12 months. |
| Annual maintenance | under 20% of value | Still economical — normal operation, keep running. |
| Maint. cost / mile | > class average | The single most reliable trigger — reflects real performance. |
| Downtime | > 2 breakdowns / qtr | No longer reliable enough for a scheduled service. |
| TCO crossover | ~ years 7–9 | Where keeping starts costing more than replacing. |
Swipe to compare →
The strongest replacement triggers are multi-factor: a unit that crosses two or more thresholds at once — say, maintenance cost per mile above its class average and more than two breakdowns a quarter — is a high-confidence candidate, not a borderline call.
The cost of ignoring these triggers is measurable. Research suggests most fleets hit the economic crossover point months before they act on it, carrying thousands of dollars of excess cost per vehicle in that lag. And once maintenance reaches 30% of value, it typically escalates fast — often hitting 50% the next year. Catching a unit at the trigger, not a year past it, is where the policy pays for itself. Book a demo to get automatic alerts when a unit crosses your thresholds
When money's tightprioritising replacements against a limited budget
Here's the reality of public fleet capital planning: the scoring model will almost always identify more replacement candidates than the budget can fund. The policy's real value is what it does next — sorting that list into tiers so the limited dollars go to the units that hurt most to keep.
This tiering is what makes a replacement policy survive a lean budget year with credibility intact. When council can only fund Tier 1, you can show exactly why those units and not others — and exactly what deferring Tier 2 will cost next year. That's the difference between a request that gets approved and one that gets tabled. Start free and turn your fleet into a ranked, tiered replacement plan
From a fleet director who took it to council
For years my replacement requests were basically me saying "trust me, this one's had it." Council would fund maybe half, usually the wrong half, because I had nothing but my word and a gut feeling about which trucks were worst.
We put a scoring policy in — age, hours, repair cost against class average, downtime, condition. Now every request goes up as a ranked list with a one-page cost trend per unit. Last budget, I walked in with the top eight scored and showed what keeping the bottom three another year would cost in repairs alone. Got seven of eight approved. The policy didn't change which trucks were bad — it changed whether I could prove it.
The takeaway
A municipal fleet replacement policy replaces gut feel with a point score across age, mileage or hours, maintenance cost, condition and downtime — ranked, consistent, and defensible.
Age and mileage flag candidates; the real triggers are cost-based — the 50/30/20 rule, cost-per-mile above class average, and the TCO crossover around years 7–9.
When budgets fall short, tier the queue — replace, plan, monitor — so every capital dollar is defensible and every deferral has a documented cost.
A municipal fleet replacement policy isn't paperwork for its own sake — it's how you stop paying to keep the wrong vehicles running and start winning the capital arguments you deserve to win. The framework is the easy part. The hard part is the data underneath it, and that's exactly what a connected lifecycle platform handles: age, hours, cost history and condition tracked per asset, scored automatically, ready to defend. Build the policy on real records and the snowplow argument stops being a hunch and becomes a line item the council approves. Book a demo to see your fleet scored and ranked for replacement
Frequently asked questions
What is a municipal fleet replacement policy?
A municipal fleet replacement policy is a written framework that determines which government vehicles get replaced, when, and in what priority order, using consistent and measurable criteria rather than anecdotal judgement. It typically scores each unit against factors like age, mileage or engine hours, maintenance cost relative to value and class average, condition, downtime, and mission or safety importance, then ranks the fleet. The policy serves two purposes at once: it directs limited capital dollars to the vehicles that genuinely need replacing, and it produces the documented, data-driven rationale needed to justify each request to finance departments, city council, and auditors. Well-run policies treat fixed age and mileage targets as the point at which a vehicle becomes a candidate for review, not an automatic trigger, and use cost and condition data to make the final call. The framework recognised by APWA and referenced in federal guidance is often called lifecycle asset management, and the best implementations tie the policy directly to real operating data from the fleet's maintenance system.
When should a government fleet replace a vehicle instead of repairing it?
The most widely used screen is the 50/30/20 rule based on repair or maintenance cost relative to the vehicle's current value. When a single repair estimate exceeds 50% of the vehicle's value, the math no longer supports fixing it and replacement is the call. When annual maintenance reaches roughly 30% of value, the unit is nearing end of economic life and replacement should be planned within about 12 months. Below 20%, the vehicle is still economical to run. Beyond that screen, the single most reliable trigger is maintenance cost per mile rising above the average for the same vehicle class, because it reflects actual performance rather than age assumptions. The strongest signals are multi-factor: a vehicle that crosses two or more thresholds simultaneously — high cost per mile plus frequent downtime, for example — is a high-confidence replacement candidate. It's worth acting promptly, because once maintenance costs reach 30% of value they tend to escalate quickly, often reaching 50% the following year.
What factors go into a fleet vehicle replacement scoring system?
A replacement scoring system assigns points to measurable lifecycle factors and combines them into a total score so units can be ranked consistently. The core factors are age (scored against a target life for the vehicle class), mileage or engine hours (scored against expected lifecycle usage, with hours used instead of miles for equipment like snowplows and loaders), maintenance cost (relative to the vehicle's value and its class average, usually the heaviest-weighted factor), and condition plus downtime (inspection-based condition and how often the unit is out of service). Many policies add a mission-and-safety override that can move a vehicle up the queue regardless of its score — for structural safety concerns, failed inspections, or units essential to critical services. A published real-world example is the City of North Salt Lake's 15-point system, which scores age, mileage or hours, and maintenance cost. The result is a single ranked number per vehicle plus a documented rationale, which is what lets a fleet manager explain and defend decisions to finance teams and elected officials.
Why isn't age or mileage alone enough to decide replacement?
A fixed age or mileage cutoff is simple and objective, which is why it's common, but it treats every vehicle in a class as identical when real condition varies enormously. A garaged administrative sedan and a hard-working utility truck of the same age and mileage are in completely different states of wear. Relying on age or mileage alone does damage in both directions: it retires healthy, low-use units too early, throwing away usable life and residual value, while keeping high-repair units in service simply because they haven't hit the arbitrary number yet. Research also shows that vehicle age often drives maintenance cost per mile more than mileage does, and the lowest-mileage vehicle is frequently not the lowest-cost one to keep. The best-practice approach uses age and mileage targets to flag a vehicle as a candidate for review, then brings in condition, maintenance cost, cost per mile against class average, and downtime to make the actual decision. That's the entire argument for a multi-factor scoring model over a calendar rule.
How do fleets prioritise replacements when the budget is limited?
The scoring model will almost always surface more candidates than the budget can fund, so the policy's job is to tier the queue. A common approach uses three tiers. Tier 1, replace now, covers safety concerns, failed inspections, units past the 50%-repair-to-value line, and the highest scores — these are funded first. Tier 2, plan and budget, covers units past their age or mileage targets with maintenance approaching 30% of value; these are slated for the next cycle with funding staged and trends watched. Tier 3, monitor, covers units that are candidates by age but still economical, which are re-scored periodically and sometimes reassigned to lower-use roles rather than replaced. This tiering is what lets a fleet manager defend a lean budget year: when council can only fund Tier 1, you can show precisely why those units and not others, and quantify what deferring Tier 2 will cost in additional repairs next year. It turns a capital request from an argument into a documented, ranked plan.
Walk into the budget meeting with a ranked list, not a hunch
HVI tracks every asset's age, meter hours, maintenance cost history and condition, then turns it into replacement scores and a tiered capital plan — with a one-page cost trend per unit ready to hand to finance or council. Stop losing replacement arguments you should win. Live on your fleet in under two weeks.
No credit card · Built on your existing records · Council-ready reports