"Digital twin" gets used to describe everything from a spreadsheet to a live physics simulation — and municipal fleet directors are the ones paying the price when a vendor's "digital twin" turns out to be a dashboard. A true digital twin is a real-time virtual replica of your fleet fed by continuous operational data, used to simulate scenarios: replace-vs-repair, EV transition, budget cuts, utilization changes. It's not the same as a fleet analytics platform — and neither is the same as an asset database. Book a demo .
Asset Database. Analytics Platform. Digital Twin.
Vendors use all three terms interchangeably. They aren't. Each tier answers a different question — and costs a very different amount.
A digital twin without the underlying operational data is a graphics engine. The value of the twin comes from the accuracy of what feeds it — every asset record, every meter reading, every completed inspection, every closed work order. Municipal fleet teams evaluating digital twin platforms often skip past this reality because vendors don't emphasize it: the simulation is downstream of the data foundation. Get the tier-1 data right and tier-2 analytics and tier-3 simulation become genuinely useful. Get it wrong and any output above tier 1 is confident-sounding fiction.
The 5 municipal fleet scenarios digital twins can modelEach simulation is a probability estimate, never a guaranteed forecast
The value proposition of a fleet digital twin is scenario analysis — testing what would happen under different planning decisions before committing budget. Below are the five scenarios most commonly modeled for municipal fleets, with a plain description of what the twin actually does and what it doesn't. Book a demo to walk through which of these your team needs first
Replace vs repair
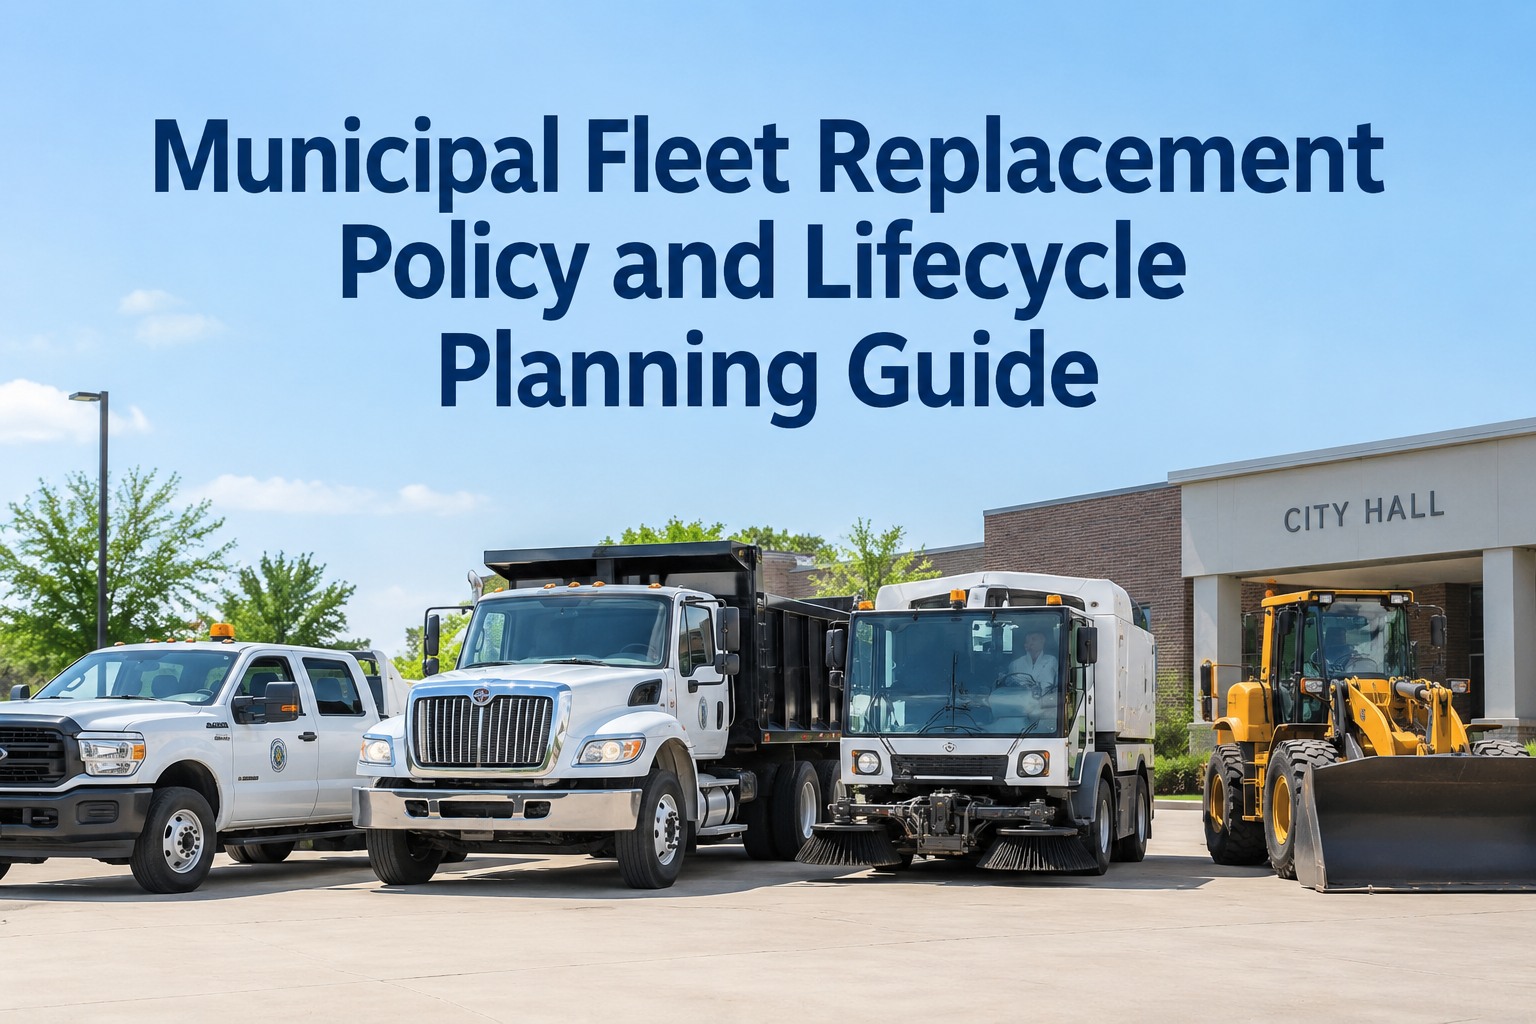
Combines maintenance history + current cost trajectory + residual value + downtime cost to estimate the crossover point where repair becomes more expensive than replacement. Output is a probability curve, not a single date.
Fleet rightsizing
Uses utilization data (miles, hours, active days) to identify assets running below effective utilization thresholds. Simulates service impact of reducing fleet size and reallocating remaining assets.
Utilization changes
Models what happens when service demand shifts — new routes, seasonal spikes, expanded service area. Estimates impact on wear, maintenance cost, and required fleet capacity.
EV transition planning
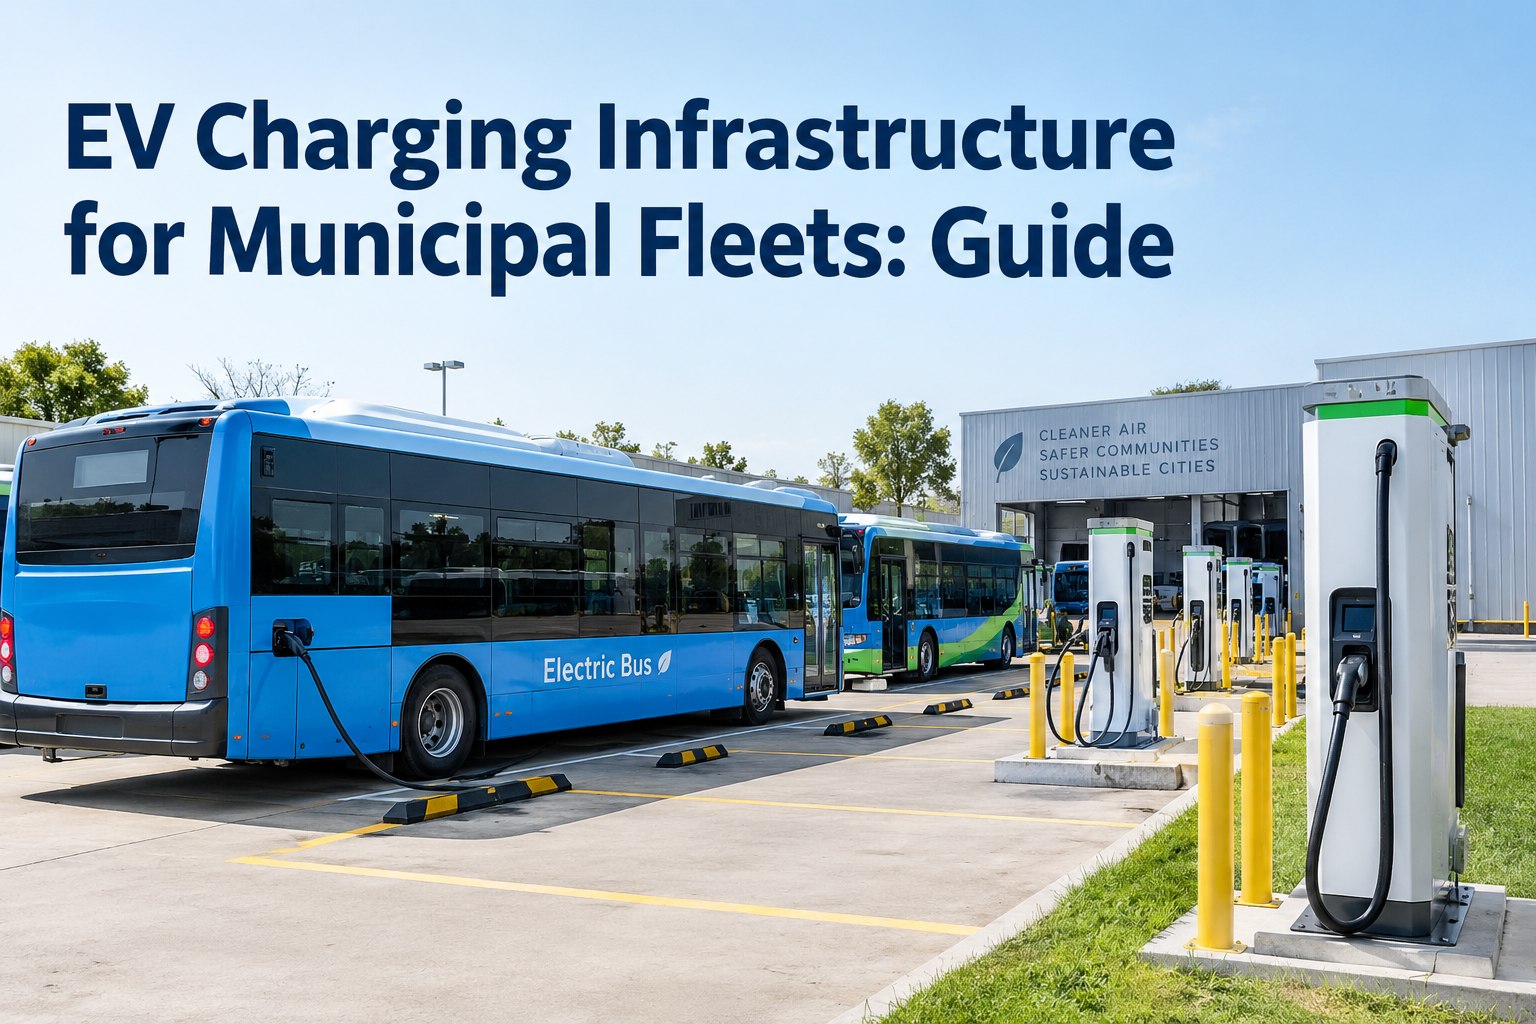
Scores each asset on EV suitability (duty cycle, daily range, dwell time), models 8-year ICE vs EV TCO per segment, and estimates infrastructure requirements. Sequences conversions against replacement timeline.
Budget reductions
Simulates cascading effects of deferred capital, extended replacement cycles, or reduced PM frequency. Estimates the maintenance-cost curve when replacement is delayed 1, 2, or 5 years past optimal.
Multi-year capital planning
Rolls asset-level projections into fleet-wide 5-year and 10-year capital plans. Supports budget submissions and council presentations with defensible, data-anchored numbers.
Scenario simulation is powerful when the underlying operational data is accurate — and useless (or worse, misleading) when it isn't. Book a demo to see the tier-1 data structure that any of these scenarios depends on
The 5 data prerequisites for any credible fleet twinMissing any of these and the simulation output is unreliable
Digital twin vendors will tell you their platform can start delivering value in 90 days. What they may not emphasize: the 90 days assumes you already have clean, complete, structured data. Municipalities coming from paper records or spreadsheet-based tracking typically need 6–12 months to establish these prerequisites before the twin has anything reliable to work with. Start a free trial and get the tier-1 data structure right first.
Accurate, complete asset records
Every unit with VIN, class, acquisition date, cost, upfit configuration, current condition. Not scattered across three systems. Not partial. One record per asset, kept current.
Maintenance history at the asset level
Every work order tied to a specific unit, with parts consumed, labor hours, technician, findings, close-out. Not summary-level totals — asset-level detail queryable across years.
Mileage and engine-hour meter data
Both meters, updated regularly (ideally automated from telematics). Odometer alone misses idle-heavy assets; hours alone misses highway-heavy assets. Both, over time, are what the twin models against.
Operating costs per asset
Parts + labor + fuel + tires + external services + downtime cost, attributed to specific units, over time. Fleet-level averages don't tell the twin which units are the cost outliers.
Reliable utilization data
Active days, active hours, mileage per period. Utilization is what separates a truck that's expensive to maintain from a truck that's expensive because it works hard. The twin needs both.
Nail all five of these prerequisites first and any tier-3 investment downstream produces useful output. Skip any of them and the twin is generating confident numbers with no reliable basis. Book a demo to see how HVI structures all five data layers for municipal fleets
From a public works fleet director exploring digital twin technology
We looked at three "digital twin" platforms for our 280-unit fleet last year. First vendor's twin was actually a Power BI dashboard. Second one had a real simulation engine but required data we simply did not have in the format they needed — twelve years of maintenance records still in filing cabinets. Third was closer to the real thing but was quoted at $180K annually plus an implementation project we couldn't fund.
What we did instead: focused on tier 1 first. Got every asset into digital records with full maintenance history, meter data pulled automatically from telematics, and cost trending. Twelve months later our own team can answer 80% of the scenario questions the twin was going to answer — because we finally had the underlying data. When we do buy a tier-3 twin, it'll actually work. Skipping tier 1 to buy tier 3 was going to be a $200K learning experience.
Frequently asked questions
What's the difference between a digital twin, a fleet analytics platform, and an asset database?
Three different technology tiers answering three different questions. An asset database (tier 1) is structured records of what you own — assets, inspections, work orders, PM history — and answers "what do we have and what happened to it?" A fleet analytics platform (tier 2) sits on top of an asset database and adds trending, KPIs, dashboards, and reporting on historical data — it answers "what patterns exist in what happened?" A digital twin (tier 3) sits on top of both and adds a live virtual replica fed by continuous telematics/IoT data plus physics-based or AI simulation — it answers "what would happen if we changed X?" Each tier depends on the one below it. A digital twin running on incomplete asset records or thin maintenance history produces confident-sounding but unreliable output. Municipalities skipping tier 1 or 2 to buy tier 3 are the ones who end up with expensive dashboards that don't inform actual decisions.
What scenarios can a fleet digital twin actually simulate?
The most common municipal scenarios: replace-vs-repair (crossover analysis where continued repair costs exceed replacement value); fleet rightsizing (identifying under-utilized assets and modeling service impact of downsizing); utilization changes (simulating new routes, service expansion, seasonal demand); EV transition planning (scoring assets on EV suitability, modeling ICE-vs-EV TCO over 8-year lifecycle, sequencing conversions); budget reductions (modeling maintenance-cost curves when replacement is deferred 1, 2, or 5 years); and multi-year capital planning (rolling asset-level projections into 5-year and 10-year capital submissions). Every one of these outputs is a probability estimate based on historical patterns projected forward — not a guaranteed forecast. Present results to council or finance with confidence intervals and scenario ranges, not single-point predictions.
Does HVI provide a digital-twin simulation engine or EV transition modelling?
No. HVI does not provide a digital-twin simulation engine, does not offer EV transition modelling, does not perform capital-plan optimization, and does not run financial scenario modelling. Those are tier-3 capabilities in the framework this article describes, typically delivered by purpose-built simulation platforms (PTC ThingWorx, Dassault 3DEXPERIENCE, and specialized fleet-twin vendors are examples of that category). What HVI provides is the tier-1 foundation: fleet asset records, inspection history, preventive maintenance scheduling, work orders, meter tracking on mileage and hours, and maintenance analytics. This is the underlying operational data that any credible tier-2 analytics platform or tier-3 digital twin has to be built on — and it's the layer most municipalities need to strengthen first before tier-3 investments produce reliable output.
What data does our fleet need before a digital twin can produce useful output?
Five prerequisites: accurate and complete asset records (every unit, VIN, class, acquisition, upfit, current condition, in one system); asset-level maintenance history (every WO tied to a specific unit with parts, labor, findings, close-out, queryable across years); mileage and engine-hour meter data (both meters, updated regularly, ideally automated); operating costs attributed to specific assets over time (parts, labor, fuel, tires, external services, downtime); and reliable utilization data (active days, active hours, mileage per period). Digital twin vendors often quote 90-day timelines that assume this data already exists in the right format. Municipalities transitioning from paper or spreadsheet tracking typically need 6–12 months to establish these prerequisites before the twin has anything reliable to work with — and that data-cleanup phase is usually the highest-value part of the entire investment, twin or not.
Should municipal fleets buy a digital twin before completing data digitization?
No, and this is the most common expensive mistake in municipal fleet tech procurement. A tier-3 digital twin platform typically costs six figures annually plus implementation. If the underlying tier-1 data is incomplete or inaccurate, the twin's output is confident-sounding but unreliable — and using unreliable scenario projections to make capital and budget decisions produces worse outcomes than using no scenario projections at all. The sequenced approach that consistently produces value: (1) digitize asset records and maintenance history in a CMMS; (2) get meter data flowing automatically; (3) let 12–18 months of clean operational data accumulate; (4) evaluate tier-2 analytics needs against that data; (5) only then evaluate whether tier-3 simulation capabilities justify the additional cost. Skipping straight to tier 3 is how municipalities end up with expensive dashboards that don't inform actual decisions. Build the foundation first.
Build the operational data your fleet planning depends on
HVI supports fleet asset records, inspection history, preventive maintenance, work orders, meter tracking on mileage and hours, and maintenance analytics. Digital-twin simulation, EV transition modelling, capital-plan optimization, and financial scenario modelling are separate tier-3 capabilities delivered by purpose-built simulation platforms. HVI is where the underlying operational data lives — the foundation any credible planning technology has to be built on.
No credit card · No hardware · Tier-1 data foundation ready on day one