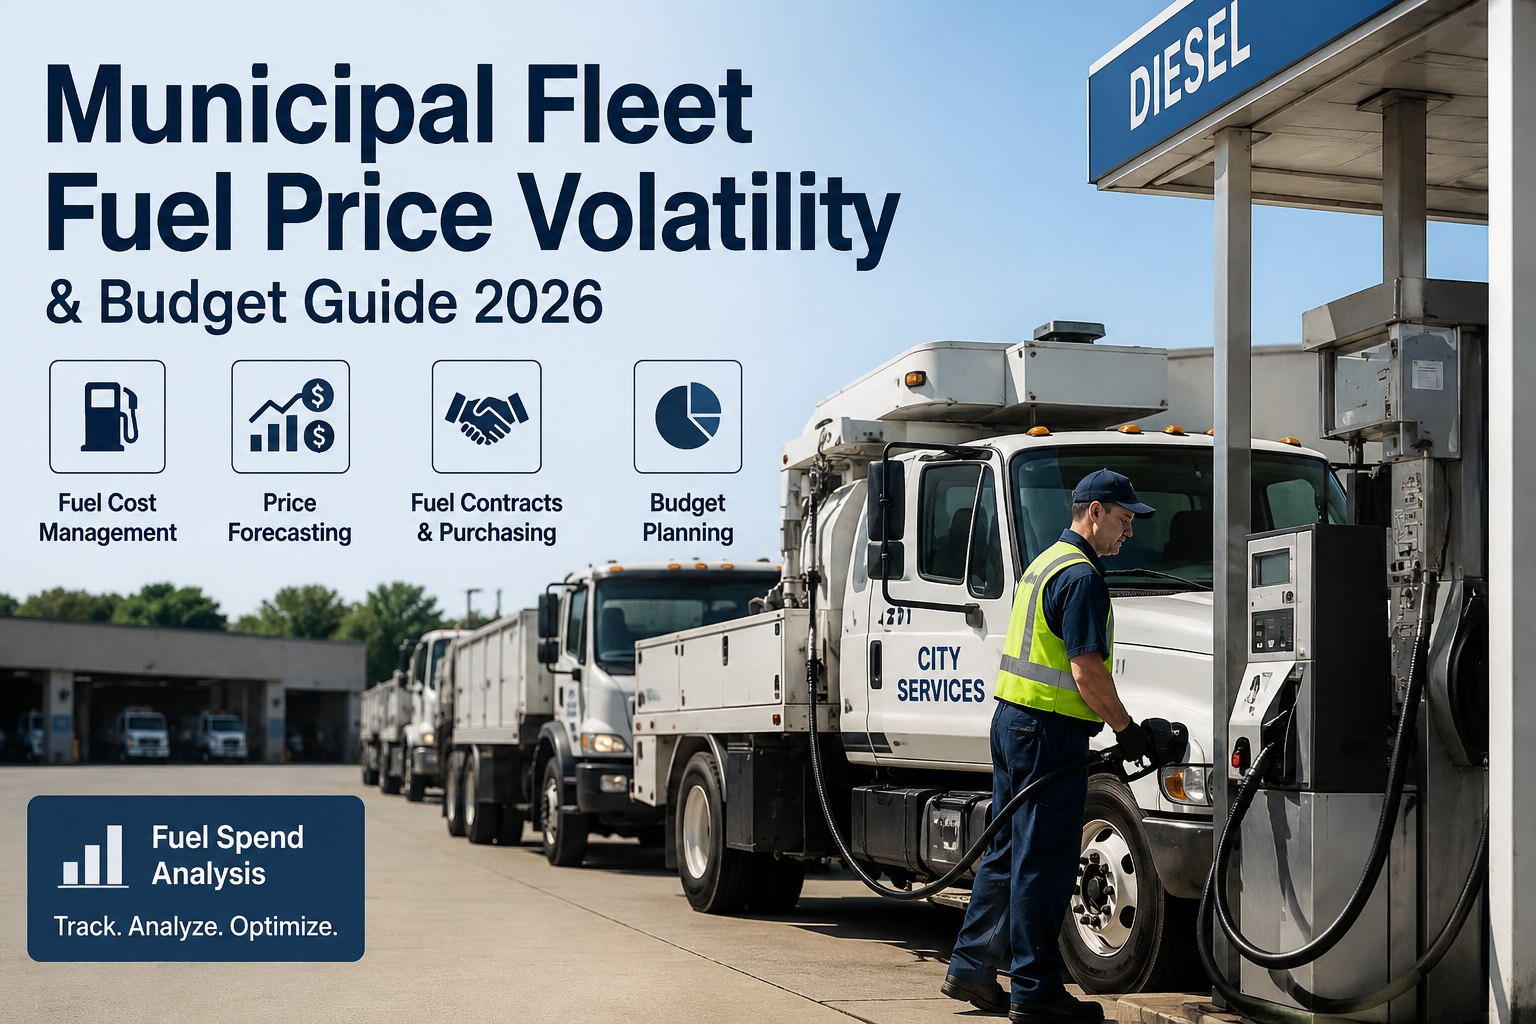
Municipal fleet fuel budgets are set annually via city council approval, but diesel and gasoline prices don't respect the fiscal calendar. Retail diesel swung between roughly $3.20 and $5.64 per gallon during 2026 alone. When a commercial fleet absorbs a spike, they raise customer surcharges. When a municipal fleet absorbs a spike, they file a budget variance and explain to the city manager why line-item fuel is running $340K over. This 2026 municipal fleet fuel price volatility guide walks the 3 fuel contract structures, bulk purchasing economics, and the consumption-visibility layer that separates predictable budgets from year-end scrambles. Book a demo .
Three Fuel Contract Structures — Which One Fits a Municipal Budget?
Commercial fleets can pass cost through. Municipal fleets can't. Contract structure is where budget defensibility starts.
Municipal fleet fuel management sits at the intersection of two different disciplines that rarely talk to each other: procurement (which writes the contract) and operations (which burns the fuel). Procurement is thinking about supplier selection, contract structure, and multi-year purchasing agreements. Operations is thinking about idle time, route efficiency, and per-vehicle consumption. Fuel budget performance depends on both. A great contract on a fleet that idles 2 hours per truck per day still overspends. Great operational discipline on a variable-rate contract still runs over when the market moves. This guide walks both sides and where they connect — because the fleets that stay on budget through volatile years work both, not one.
Bulk purchasing and on-site storage — when the economics workThe wholesale-vs-retail spread that pays back tank installation
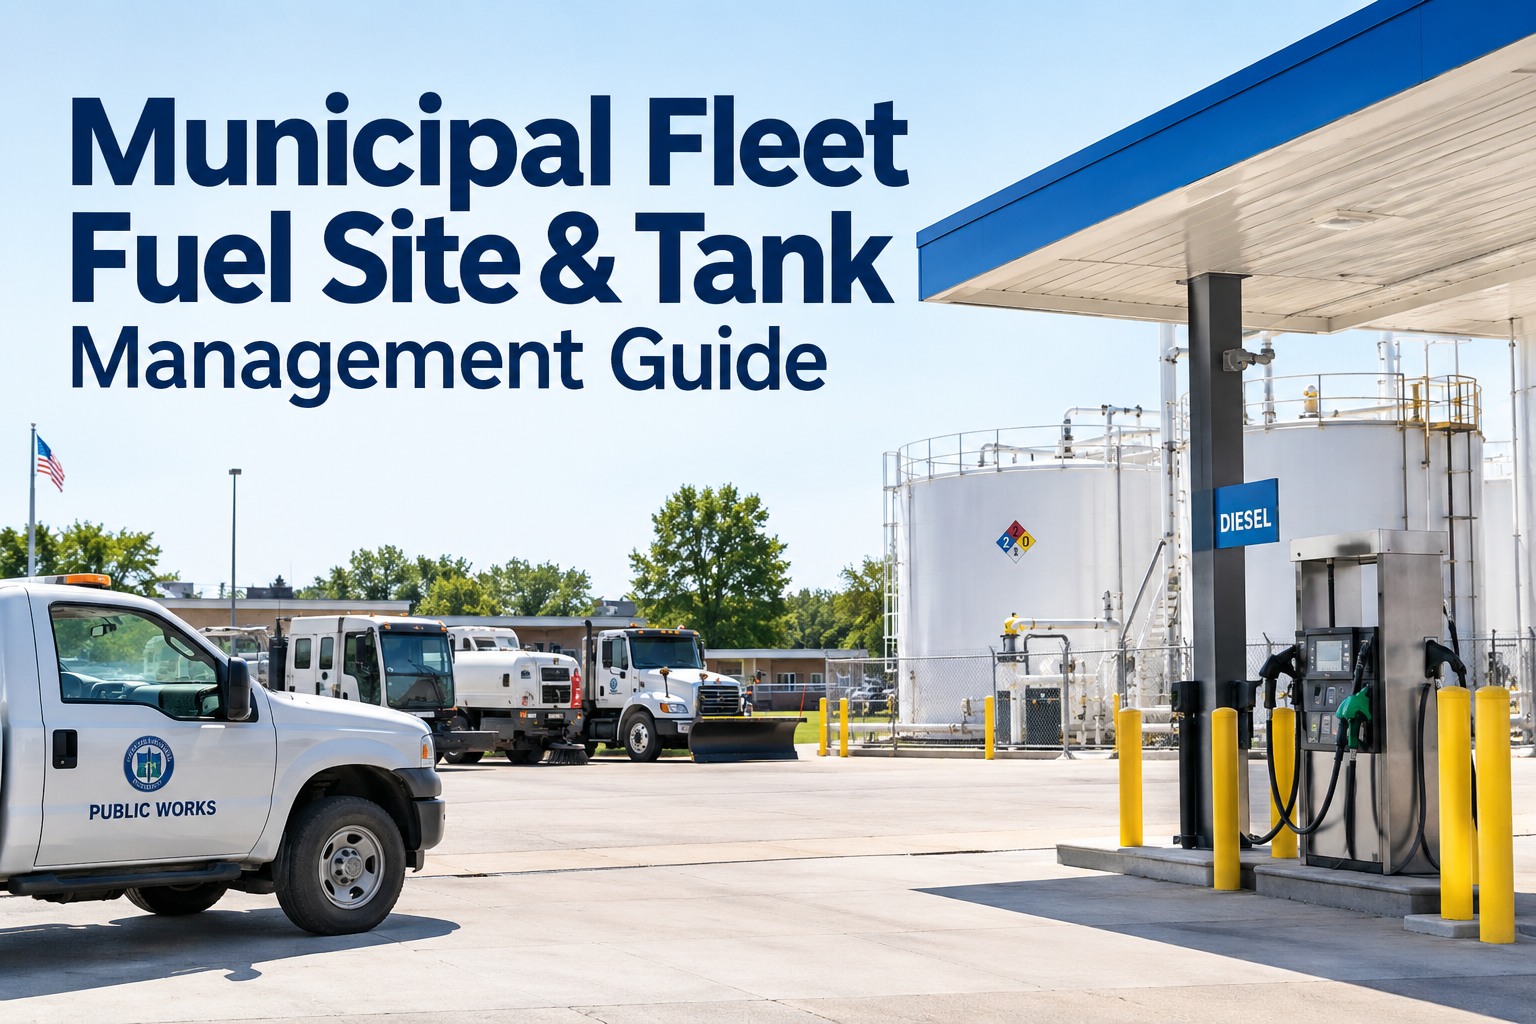
On-site fuel storage moves purchasing from retail (with markup) to wholesale (with tanker-truck-delivery pricing). For central-yard municipal fleets returning to a common depot daily, the economics often work — but not universally. Understanding when bulk storage pays back and when it doesn't matters more than the theoretical savings. Book a demo to see fuel spend tracking against bulk delivery invoices in HVI
Installation cost baseline
Above-ground fuel tanks and dispensing infrastructure typically run $15K–$50K installed depending on capacity, containment requirements, and site preparation. Underground tanks add environmental permitting cost and long-term liability. Municipal projects often carry additional public-works overhead for procurement compliance.
Wholesale-vs-retail spread
Wholesale bulk delivery typically runs $0.20–$0.60 below retail rack per gallon depending on volume, region, and supplier. For a 400,000 gal/yr fleet, that's $80K–$240K annually against the retail baseline — before contract structure adjustments.
Payback threshold
Rule of thumb from private-fleet operators: fleets consuming 200,000+ gal/year with a central yard where trucks return daily typically see 12–18 month payback on tank installation. Below that consumption, the fixed installation cost is harder to justify without other benefits.
When bulk doesn't work
Multi-yard fleets without a common depot. Fleets with heavy in-route retail fueling that can't be repatriated. Fleets whose consumption is highly variable seasonally (peak-and-trough operations). Fleets where regulatory or environmental restrictions on above-ground storage add cost.
Supplier diversification
Bulk fuel is only as reliable as the delivery relationship. Multi-supplier arrangements — primary + secondary + emergency — are standard practice for larger municipal fleets to protect against single-supplier supply disruption or price manipulation.
Inventory carrying cost
Bulk inventory is capital tied up in fuel. If diesel drops $0.75/gal after a fleet took delivery on 20,000 gal, that's $15K of paper loss. Not usually a driver but relevant when procurement is evaluating storage size sizing.
Consumption visibility — the operational layer procurement doesn't seeWhere cost-per-mile stops matching budget-per-mile
Contract structure and bulk purchasing are procurement's lever on fuel spend. Consumption is operations' lever — and it's the layer where most municipal fleets have the least visibility. A well-negotiated fuel contract on a fleet burning 20% more than baseline still overspends. Consumption forecasting is what closes the gap.
Idle time per vehicle
Consumption vs miles-driven ratio
Fuel-card outlier transactions
Seasonal-adjusted budget vs actual
Municipal fuel budget workflow — the 6 steps from procurement to council reportWhere contract decisions, consumption data, and finance reporting connect
Municipal fuel budgets are not a one-time exercise — they're a repeating annual cycle that connects procurement, operations, and finance. The workflow below is what a mid-size municipal fleet actually runs, and the connection points are where digital fuel spend tracking earns its place. Start a free trial to see fuel data organized for procurement handoff.
Prior-year actuals + seasonal adjustment
Consumption baseline from prior 12–24 months, adjusted for known upcoming changes (new fleet additions, retired units, service-area expansion, EV replacements). This is the volume forecast that goes into the next-year contract negotiation.
Contract structure selection
Procurement chooses fixed / indexed / hybrid based on budget certainty priority, council appetite for variance, and volume that qualifies for bulk. Multi-year contracts vs annual, single-supplier vs diversified, index reference (EIA on-highway diesel vs regional benchmark).
Budget submission to council
Line-item fuel budget submitted for council approval, typically including scenario ranges if contract is indexed or hybrid. Defensible ranges backed by prior-year actuals and current contract terms are easier to approve than point estimates with no supporting logic.
Monthly consumption + spend tracking
Per-vehicle consumption logged, fuel-card transactions reconciled, bulk delivery invoices matched to contracted rates. Monthly rollup against year-to-date budget target with variance explanation for any deviation.
Mid-year variance review
Q2 or Q3 review of year-to-date fuel spend vs budget. If tracking over, identify operational levers (idle reduction, route adjustments) or procurement levers (renegotiation, additional bulk delivery). If tracking under, document why so it's not misread as under-utilization.
Year-end reconciliation + next-year baseline
Total spend vs budget with variance analysis. Contract performance vs benchmark (did the indexed contract beat what a fixed contract would have produced?). Baseline resets for next-year procurement cycle. Council-facing summary of what drove the year's actual.
From a municipal fleet operations manager on the budget cycle
We run 180 units across public works, water utility, parks, and code enforcement. Fuel spend is the third-largest line in our operating budget. For a long time, procurement handled contracts and operations handled everything else — and the two teams talked to each other exactly twice a year: at budget submission and at year-end reconciliation. The second conversation was usually about the variance.
What changed was getting monthly per-vehicle consumption in front of both teams. When procurement can see that 15 units are running 12% over consumption baseline, they know to expect a variance and can either flag it or adjust the mid-year forecast. When operations can see how their consumption maps to the contracted rate, they know which levers actually move the budget. Our last two fiscal years came in within 3% of budget. Not because fuel prices got easier — because both teams had the same data.
Frequently asked questions
How do municipal fleets manage fuel price volatility?
Municipal fleets manage fuel price volatility through a combination of contract structure choices, bulk purchasing where volume justifies it, and consumption visibility on the operational side. Contract structures include fixed-price agreements (locking a flat per-gallon rate for 30–90 days up to a year, high budget certainty), index-based contracts (price moves with a published benchmark plus a fixed differential, ride the market both directions), and hybrid contracts combining fixed and indexed portions. Unlike commercial carriers, municipal fleets cannot pass fuel costs through to customers — the budget is fixed at council approval and variances require explanation. Bulk on-site fuel storage typically pays back in 12–18 months for fleets consuming 200,000+ gallons per year with a central return-to-yard depot pattern. On the operational side, consumption tracking (idle time reduction, per-vehicle gallon-per-mile baselines, fuel-card outlier detection) closes the gap between contract savings and actual budget performance. The fleets that stay closest to budget through volatile years combine both.
What are the three main types of fuel contracts?
Fleets typically choose from three fuel contract structures. Fixed-price contracts lock in a flat per-gallon rate for a defined term (commonly 30–90 days, sometimes extended to a year), providing high budget certainty because every invoice matches the contracted rate. The trade-off is no benefit if market prices drop during the term. Index-based contracts tie the invoiced price to a published benchmark (commonly EIA on-highway diesel or a regional rack price) plus a fixed per-gallon differential negotiated with the supplier. The fleet rides the market in both directions rather than betting on a locked number; this works when the fleet has budget reserve for potential variance and wants monthly transparency. Hybrid contracts combine fixed and indexed portions (a 60/40 split is common) — the fixed portion provides budget defensibility for the baseline load, the indexed portion captures market movement on variable volume. Municipal fleets often lean toward fixed or heavy-fixed hybrid because budget defensibility to council matters more than incremental optimization.
When does bulk fuel purchasing make sense for a municipal fleet?
Bulk fuel purchasing (on-site storage tanks receiving tanker-truck deliveries at wholesale rates) makes economic sense when three conditions are met. First, annual consumption is high enough to justify installation cost — industry rule of thumb is 200,000+ gallons per year, with above-ground tank installation typically running $15K–$50K including containment and dispensing infrastructure. Second, the fleet has a central return-to-yard pattern with trucks refueling on-site daily rather than in-route at retail stations. Third, procurement can manage supplier relationships including primary/secondary/emergency suppliers to protect against single-supplier disruption. Wholesale-vs-retail spread typically runs $0.20–$0.60 per gallon depending on volume and region, producing $80K–$240K in annual savings for a 400,000 gal/yr fleet against retail baseline. Bulk purchasing does not work well for multi-yard fleets without a common depot, fleets with heavy in-route retail fueling that can't be repatriated, or fleets facing environmental/regulatory restrictions on above-ground storage.
Does HVI support fuel spend tracking and budget reporting?
Yes. HVI supports tracking fuel usage per vehicle, cost trends over time, and budget performance against contracted rates — the operational data layer that supports procurement decisions and finance budget reporting. Features include fuel-card transaction import and reconciliation, per-vehicle consumption baselines with drift detection, bulk delivery invoice matching against contracted rates, month-over-month cost trend visualization, and outlier flagging for fills that don't match vehicle location, timing, or capacity. Fuel data lives alongside the fleet's inspection and maintenance records, so consumption drift can be correlated with mechanical condition or driver behavior patterns. HVI is not itself a fuel procurement platform, a commodity hedging service, or an EIA data feed — contract negotiation and financial hedging remain with procurement teams and specialty commodity brokers. What HVI does is provide the actual-spend and consumption data that makes procurement's contract choices measurable and finance's budget reports defensible.
What consumption metrics should a municipal fleet track for fuel budget performance?
Four consumption signals matter most for municipal fleet fuel budget performance. Idle time per vehicle: a truck idling 2 hours per day burns approximately 730 additional gallons per year (roughly 1 gal/hour idling), representing pure operational waste that doesn't show as a line item. Per-vehicle gallon-per-mile baseline: an 8%+ trend above the vehicle's 90-day baseline flags mechanical issues (injectors, air intake, brake drag), driver behavior changes, or route-mix changes. Fuel-card outlier transactions: fills that don't match vehicle GPS location, off-hours transactions, gallons exceeding tank capacity, or fills on days the vehicle wasn't dispatched. Seasonal-adjusted budget vs actual: rolling 12-month burn rate compared to prior-year same period, which catches drift earlier than year-to-date variance (which lags by definition). None of these are exotic metrics; the discipline is running them monthly instead of discovering variance at year-end. Municipal fleets that catch 5%–8% consumption drift at month 3 can act on it; catching it at month 11 means it's already in the year-end report.
Give procurement and finance one fuel-data source of truth
HVI supports fuel usage tracking per vehicle, cost trend analysis against contracted rates, budget performance reporting, and consumption drift detection connected to fleet inspection and maintenance history. Contract negotiation and financial hedging remain with procurement and commodity specialists. HVI is the operational data layer that makes both procurement's contract structure and finance's budget reports measurable against what actually got burned.
No credit card · No hardware · Fuel-tracking templates ready on day one