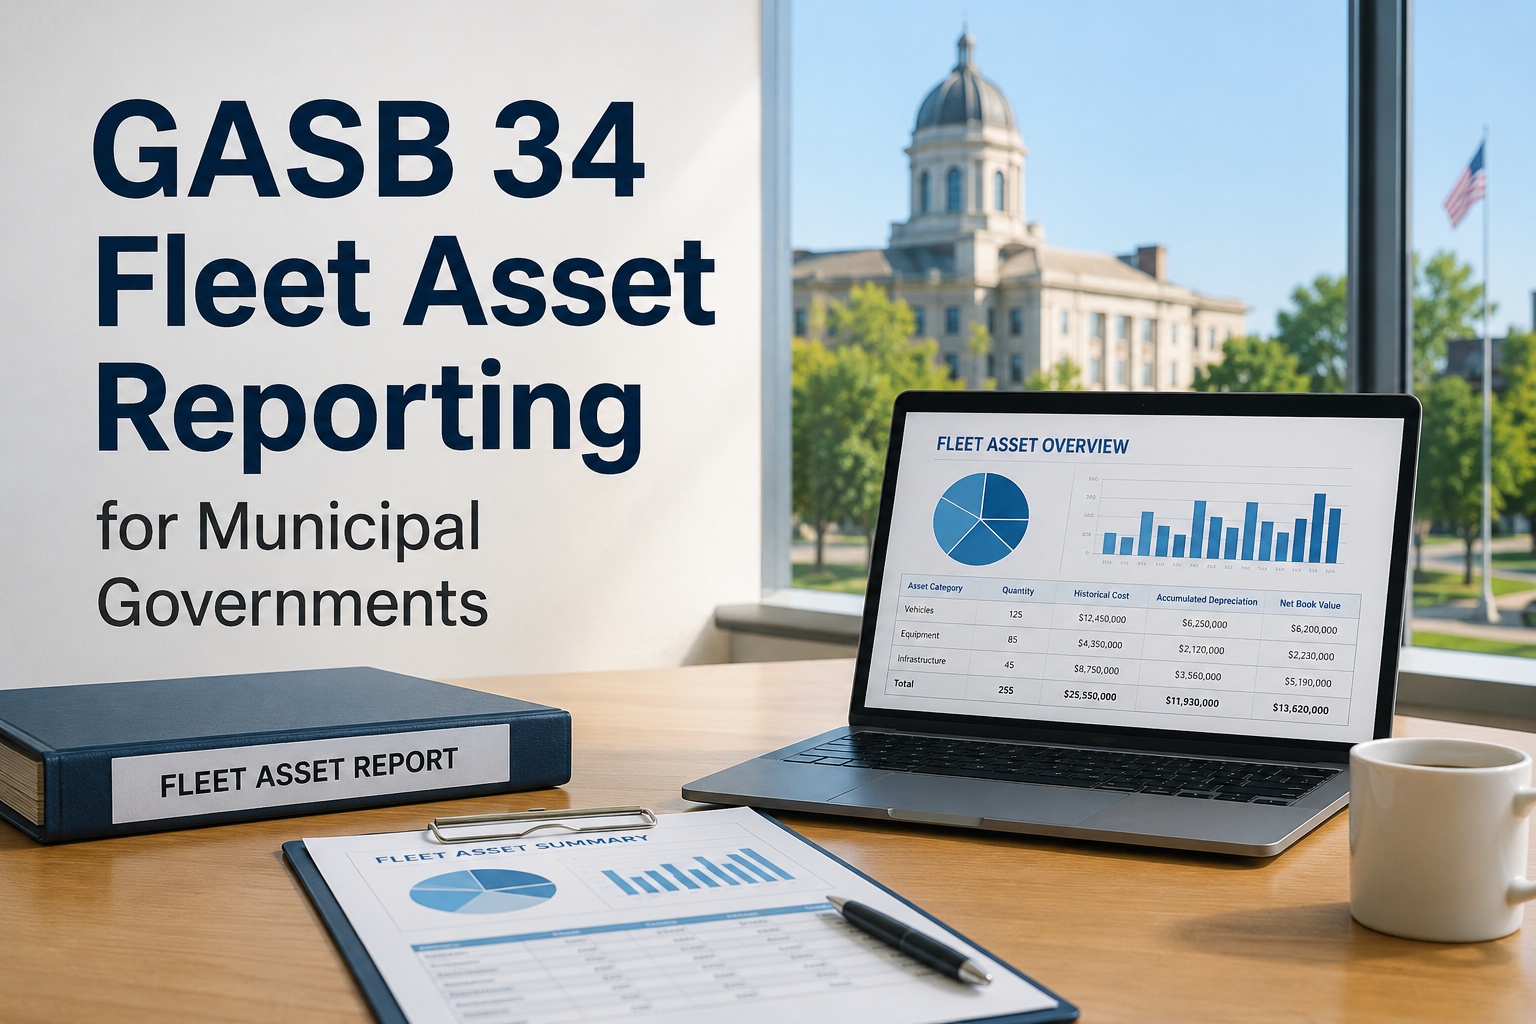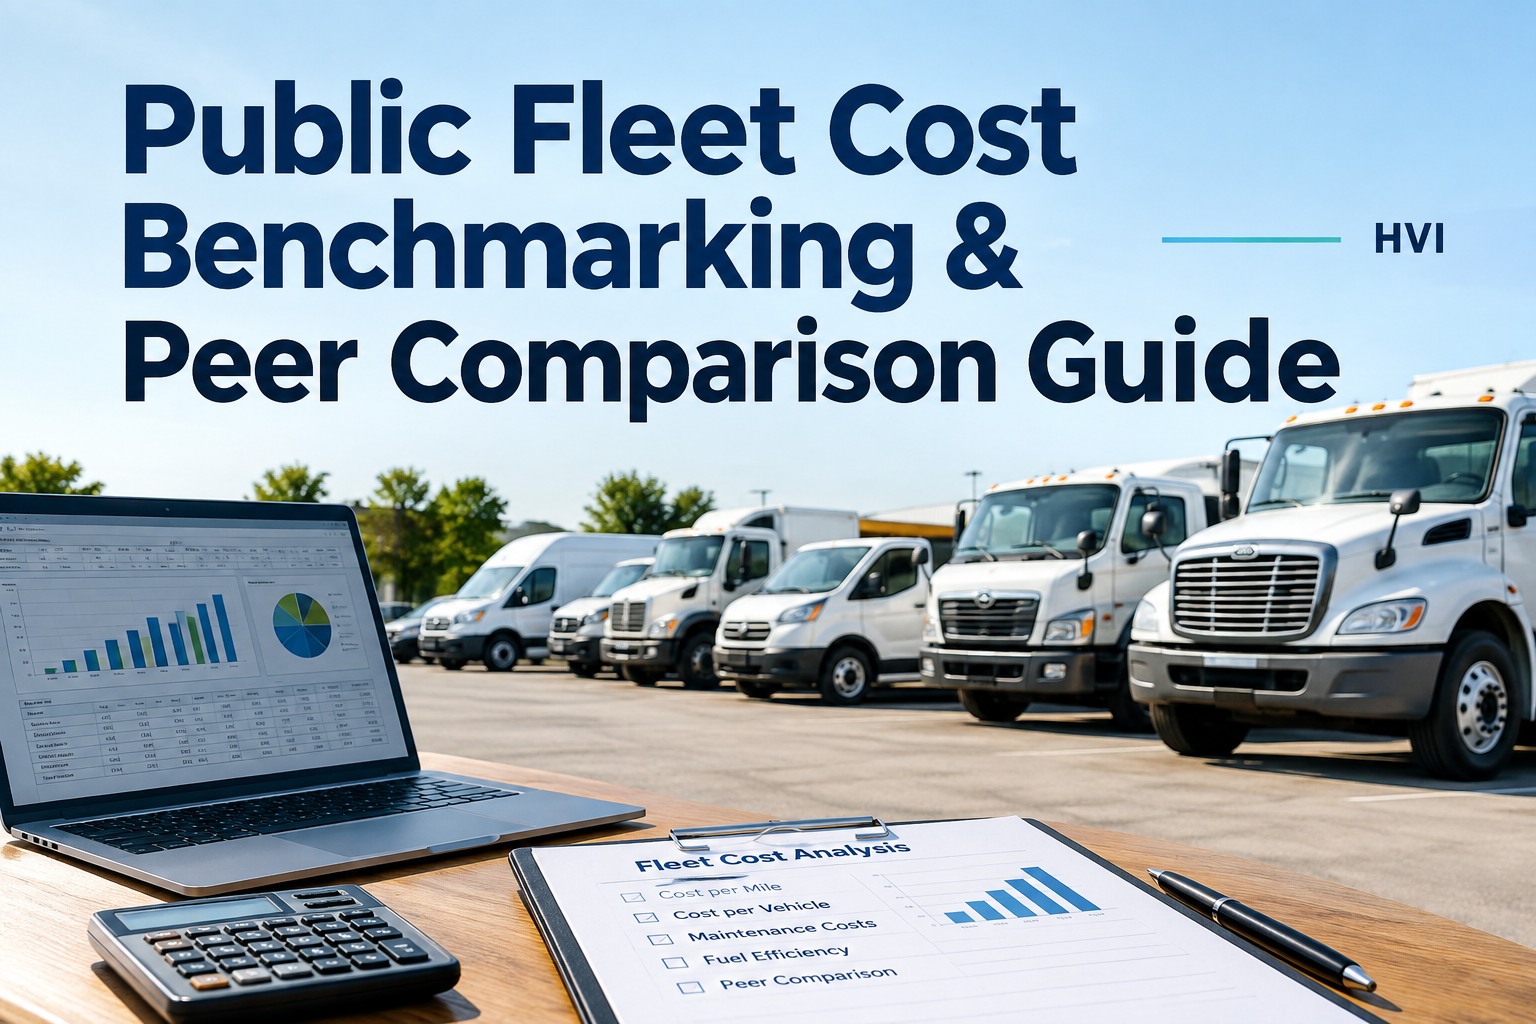
A council member drops a number in a budget meeting: "The county next door spends 40% less per vehicle than we do." Every head turns to the fleet director. The problem is, nobody in that room knows whether the other county's number includes fuel, whether their fleet is five years newer, or whether they outsource half their repairs. This is the trap at the center of public fleet benchmarking — the comparison feels precise, but the underlying numbers were never built to be compared. Getting it right is less about finding the perfect external number and more about knowing exactly what your own number is made of.
Public Fleet Benchmarking: Why the Number You're Comparing Might Be Misleading
Cost per mile, cost per vehicle, total operating cost — every fleet finance conversation eventually lands on one of these. Here's what actually goes into them, and how to compare fairly.
The Benchmarking Trap: Why "Cost Per Mile" Isn't One Number
Cost per mile sounds like simple arithmetic — total fleet cost divided by total miles driven. In practice, it's one of the most inconsistently defined figures in public fleet management, because agencies rarely agree on what "total cost" includes. One department's number might cover only parts and labor. Another folds in fuel, tires, outside repairs, and shop overhead. A third adds depreciation and insurance. Put three of those numbers side by side and you're not comparing fleets — you're comparing accounting choices.
This is the core problem with public fleet cost benchmarking done casually: a lower number doesn't necessarily mean a leaner operation. It might mean an older fleet with deferred maintenance, a narrower cost definition, or repairs pushed into next year's budget. Before any comparison goes into a council presentation, the first question should be what, exactly, is inside each agency's figure — not what the figure says. Pulling that answer from your own data is far easier when every repair and labor hour is already tied to the vehicle it belongs to.
What Actually Belongs in a Fleet Cost Comparison?
A defensible benchmark starts with a consistent list of cost components. Here's how most of them typically get treated — though every agency should confirm this against its own finance policy before publishing a comparison.
Usually included
- Parts and materials
- Labor (in-house technician time)
- Outside/vendor repair services
- Fuel
- Tires
Often inconsistent
- Shop overhead & facility cost
- Administrative & supervisory time
- Insurance premiums
- Depreciation or replacement reserve
Frequently excluded
- Downtime / lost productivity cost
- Driver training expense
- Capital acquisition cost
- Grant-funded upgrades
Notice that the "often inconsistent" column is exactly where most peer comparisons quietly fall apart — one agency treats shop overhead as a fleet cost, another buries it in a general facilities budget, and the resulting gap has nothing to do with actual efficiency. Before pulling a cost-per-vehicle report for a council presentation, it's worth confirming this list matches what the peer agency actually measured.
The Comparability Problem: Why Your Peer Agency's Number Doesn't Match Yours
Even with identical cost definitions, two fleets rarely operate under identical conditions. These five variables explain most of the gap between agencies that look similar on paper — and they're the first thing worth checking with a walkthrough of your own segmented cost data before trusting an outside comparison.
Fleet age
Cost per mile climbs sharply as assets age — a fleet running mostly 10+ year units will never match one on a tight replacement cycle.
Asset class mix
A fleet heavy on light sedans costs nothing like one built around plows, dump trucks, and heavy equipment. Compare like to like, not fleet-wide.
Climate & geography
Road salt, extreme heat, and mountain grades all accelerate wear differently — a coastal fleet and a mountain fleet aren't the same experiment.
Utilization
Low-mileage vehicles spread fixed costs over fewer miles, inflating cost per mile even when total spend is modest.
Service model
In-house shops, outsourced maintenance, and hybrid models each carry cost differently — a low internal-labor number can just mean more is billed externally.
Data quality
A benchmark is only as honest as the records behind it — missing work orders and lump-sum invoices distort any number built on top of them.
Internal Trending vs. External Peer Comparison
Once the definition and comparability issues are on the table, it's worth asking which comparison actually drives a better decision.
External peer benchmark alone
- Definitions rarely match exactly
- Fleet age, climate, and mix differ
- Easy to cherry-pick a flattering (or damning) comparison
- Useful for context, risky as a verdict
Internal year-over-year trending
- Same fleet, same definitions, same data source
- Isolates real cost movement over time
- Flags which department or asset class is driving change
- Supports budget requests with your own history
External benchmarking still has a place — it's a useful gut check and a way to show a council your agency isn't a national outlier. Just treat it as an investigation tool rather than a scorecard. The more defensible number, especially in a budget hearing, is almost always "here's how our own cost per vehicle moved over the last three fiscal years, and here's exactly why." Building that history is easiest when it's captured automatically rather than reconstructed each spring — try tracking it for one department first to see how the trend line looks after a full fiscal year.
Building a Benchmark You Can Actually Defend
Whether the comparison is internal or external, the sequence that produces a credible number is the same four steps, in order.
-
1
Segment before you compare
Break the fleet into asset class, age band, application, and department — a fleet-wide average hides more than it reveals.
-
2
Normalize the cost inputs
Confirm each segment (and each peer, if comparing externally) uses the same definition of cost before the numbers ever get placed side by side.
-
3
Baseline against your own history first
Establish 2–3 years of internal trend data by segment before looking outward — this is what most cost swings will actually be explained by.
-
4
Bring in external context last
Use peer or industry figures to frame the conversation, not to set the target — and always disclose what's included when you present them.
Steps one and two are where most fleets stall, because pulling clean, segmented cost data by hand from separate maintenance, fuel, and parts systems takes days. See how HVI segments cost automatically by vehicle, department, and fiscal year before your next budget cycle starts.
Fleet KPIs Councils and Finance Teams Actually Want to See
Not every metric earns a place in a budget presentation. These five tend to answer the questions councils and finance officers actually ask.
That last figure earns particular attention in budget hearings: when annual repair spend on a single vehicle approaches 30–40% of what the vehicle is worth, it becomes a data-backed replacement request instead of a guess. Agencies moving off spreadsheets often start tracking these KPIs on a single department before rolling the reporting out fleet-wide.
What a Finance Officer Actually Wrestles With
Every budget season someone brings me a chart comparing our cost per vehicle to three neighboring counties, and every year I have to ask the same question: does that number include their shop overhead or not? Half the time nobody can tell me.
What changed things for us wasn't finding a better external number — it was finally trusting our own. Once we had three years of clean, segmented cost data by department, our replacement requests started getting approved on the first pass instead of the third.
Frequently Asked Questions
What is public fleet benchmarking?
Public fleet benchmarking is the practice of comparing a government or municipal fleet's operating costs — such as cost per mile, cost per vehicle, or total cost of ownership — against its own historical performance or against similar agencies. Done well, it segments data by asset class, age, and application, uses consistent cost definitions, and treats external comparisons as context rather than a verdict. Done poorly, it compares mismatched numbers that were never built to sit side by side, which can mislead budget decisions more than it informs them.
How do you calculate cost per mile for a public fleet?
Cost per mile is generally calculated as total fleet operating cost divided by total miles driven over a given period. The accuracy of the figure depends entirely on what's included in "total cost" — commonly parts, labor, outside repairs, fuel, and tires, with items like shop overhead, insurance, and depreciation handled inconsistently across agencies. Segmenting the calculation by asset class and age band, rather than calculating one fleet-wide number, produces a far more useful and comparable figure.
Why is comparing fleet costs between agencies so unreliable?
Cross-agency comparisons are unreliable mainly because agencies rarely define "cost" the same way, and because underlying conditions differ — fleet age, asset class mix, climate, geography, utilization, and whether maintenance is done in-house or outsourced. Two agencies can report very different cost-per-mile figures for reasons that have nothing to do with efficiency. Before treating an external comparison as meaningful, confirm both agencies are using the same cost definition and comparing similar segments of their fleets.
Is internal trending better than external peer comparison?
Internal year-over-year trending is usually more actionable because it compares a fleet against itself using consistent definitions and data sources, which isolates real cost movement rather than differences in accounting or fleet composition. External peer comparison still has value as context — for example, showing a council that costs aren't a national outlier — but it works best as a supporting reference alongside internal trend data, not as the primary basis for a budget decision.
What fleet KPIs matter most to councils and finance teams?
Councils and finance teams typically respond best to cost per mile and cost per vehicle segmented by department or asset class, preventive maintenance compliance percentage, downtime percentage, and the repair-to-value ratio, which shows annual repair spend as a share of a vehicle's current value. These metrics translate raw fleet activity into budget-relevant answers — whether a vehicle should be repaired or replaced, and whether spending trends are moving in the right direction over time.
Get cost per vehicle, department, and fiscal year you can actually stand behind
HVI centralizes maintenance, labor, and repair records so your fleet's cost data is complete, segmented, and ready before the next budget hearing — not assembled the night before from three different spreadsheets.
No credit card · No hardware · Cost reporting ready on day one