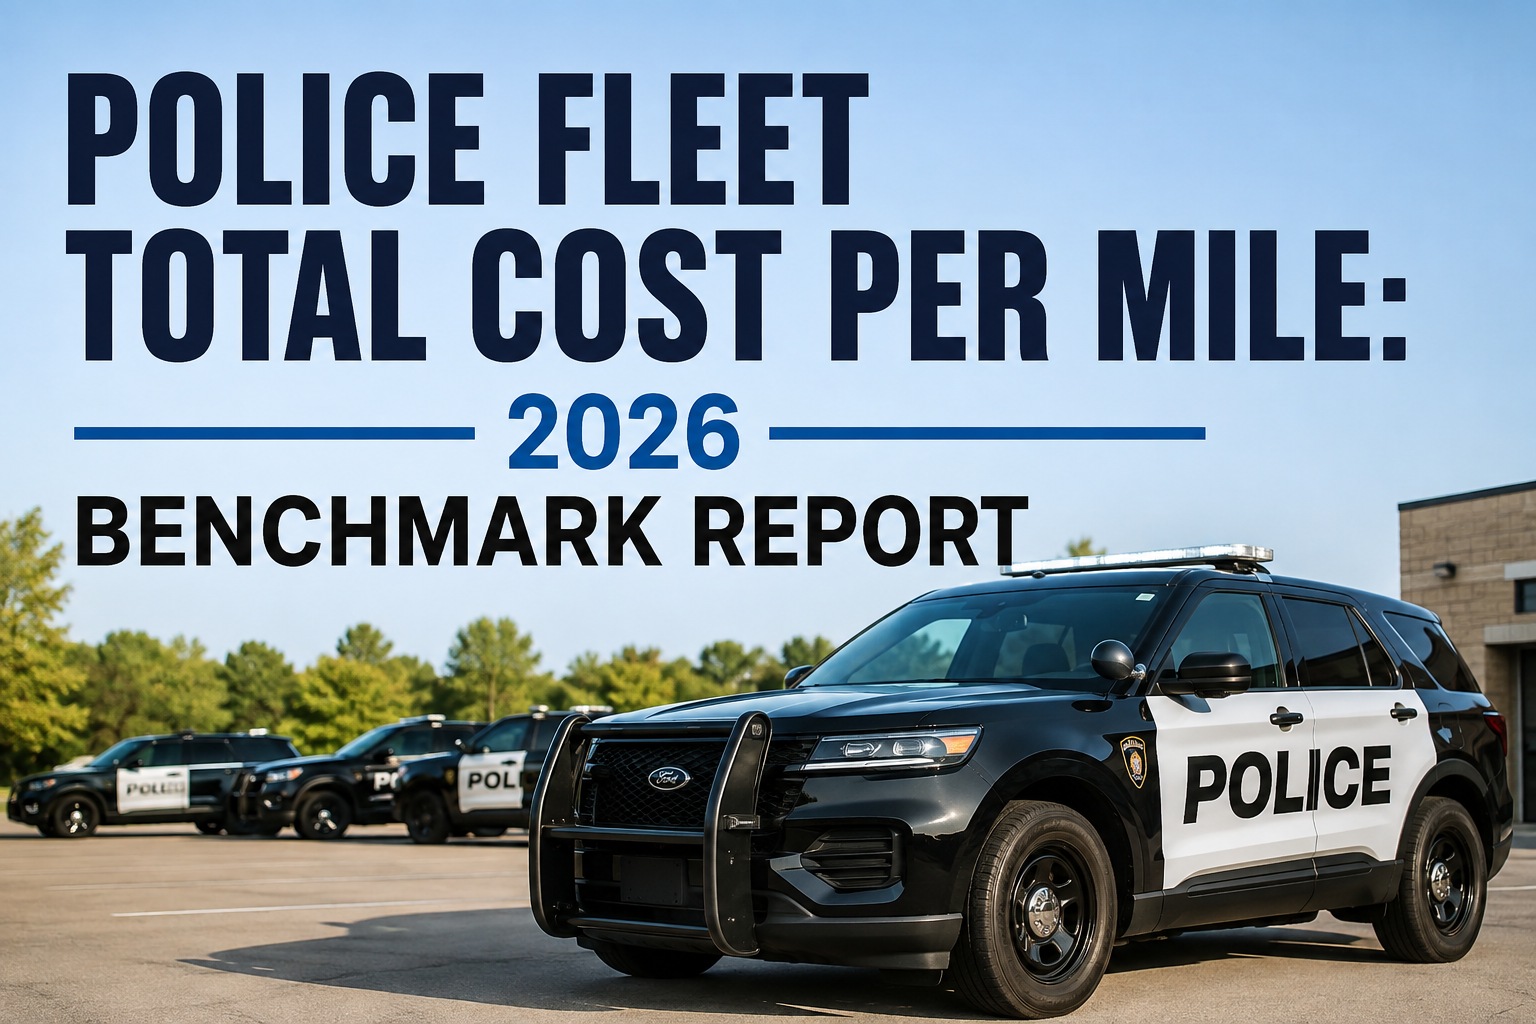
You already know your patrol units burn through brakes, tires and transmissions faster than any civilian equivalent, but when the chief asks for next year's budget, the conversation usually stalls at sticker price and fuel. Police fleet TCO — the real total cost of ownership per mile — runs close to $0.88 compared with roughly $0.62 for a standard sedan, and most of that gap hides in pursuit-severe duty cycles, idle hours and depreciation that hits the trade-in lot three years early. If you cannot break that number down by cost category, you cannot defend a replacement levy or justify the shop headcount you need. The benchmarks below are drawn from a database of 500-plus law enforcement agencies, so you can finally see where your fleet actually lands — and you can book a walkthrough to compare your own units against them before the next fiscal cycle closes.
2026 Benchmark Report · 500+ Agencies
$0.88 per mile: what a patrol car really costs in 2026
A pursuit-rated cruiser accumulates cost differently from any other asset in your yard. The breakdown below is the average across municipal, county and state agencies — use it as your baseline, then benchmark your own fleet against the same categories.
The Six Cost Buckets
Police fleet cost per mile, broken down line by line
Every dollar your fleet spends falls into one of six categories. Knowing your split — not just the total — is what lets you move money where it does the most good.
Fuel
Idle time on scene and in surveillance runs can push a patrol car's effective MPG below 8. Fuel is the line item most sensitive to driver-behaviour coaching and telematics feed integration.
Preventive Maintenance
Oil, filters, fluids and scheduled inspections. Missed PM intervals do not save money — they shift the spend into the repair bucket at two to three times the cost.
Repairs
Brakes, transmissions, suspension and electrical chasing. Pursuit-severe duty shortens component life dramatically; a structured defect-to-work-order flow keeps minor issues from becoming shop backlogs.
Depreciation
The single largest bucket. A cruiser retired at 90,000 miles instead of 120,000 lifts per-mile depreciation by roughly a third, and the residual value gap is widening as EV and hybrid patrols enter the mix.
Insurance & Risk
Liability, collision and self-insured retention. Agencies with timestamped, photo-backed inspection records routinely negotiate better terms because they can prove defect history.
Downtime
The hidden tax. A unit in the bay is a unit not on the road, and backfilling with overtime or a rental cruiser costs real money — track it as deliberately as you track fuel.
Full Loaded TCO
The all-in 2026 benchmark for a pursuit-rated patrol sedan. Your number may sit higher or lower — the point is to measure it, defend it and drive it down category by category.
Civilian Equivalent
A comparable non-pursuit sedan in commercial fleet service. The 42 percent gap is the cost of severe duty — idle hours, hard braking, high-speed runs and the electrical load of upfit gear.
Visual Cost Split
Where every dollar of police fleet cost actually goes
Seeing the split as a bar makes the leverage points obvious. Depreciation and repairs dominate; fuel and PM are the buckets where disciplined maintenance software pays back fastest.
TCO Formula
How to calculate police fleet total cost yourself
You do not need a consultant to build a defensible number. The formula is simple — the discipline is in capturing every input honestly, especially idle fuel and off-warranty repair labor.
The Core Equation
Use lifetime miles, not annual miles, for a true per-mile figure. If you only track annual cost, divide by the year's mileage for a rolling snapshot.
Worked Example: 40-Cruiser Sheriff Fleet
A 40-unit fleet averaging 30,000 miles per car per year lands right on the benchmark. If your number is $1.05 or higher, you are bleeding in repairs or downtime — and you should book a demo to see exactly where the leak sits.
Cost-Leak Breakdown
Where sheriff and police fleet budgets silently leak
Most agencies do not have a spending problem — they have a visibility problem. These are the four places where dollars leave the building without a receipt anyone acts on.
Missed PM intervals cascading into repairs
A skipped 30,000-mile transmission service does not disappear — it shows up as a $4,200 rebuild at 60,000 miles. Paper-based PM trackers miss units that rotate shifts; start logging inspections free and the overdue alerts close that gap.
Untracked idle fuel on surveillance and scene calls
A cruiser idling for six hours of a shift burns fuel without moving the odometer. That spend never hits your per-mile calculation honestly — it inflates the fuel bucket and distorts every downstream ratio.
Parts inventory bloat across multiple shops
Brake pads, alternators and filters duplicated across three substations because nobody can see what the other bay has on the shelf. The cash sits on a shelf depreciating while a unit waits for a part that is two buildings over.
Downtime backfilled with overtime or rentals
A unit in the shop for four extra days means a patrol gap — and that gap is plugged with overtime, a pool car or a rental. That cost lives in a different budget line, which is why downtime stays under-managed.
Replacement Planning
Police cruiser lifecycle: when to replace, not just when to repair
The cheapest mile is the one you drive in a correctly-timed replacement cycle. Run a unit too long and repair costs curve upward faster than depreciation savings; pull it too early and you waste residual value.
| Mileage Band | Repair Cost Trend | Depreciation Burn | TCO Impact | Recommended Action |
|---|---|---|---|---|
| 0 – 40,000 mi | Low (warranty) | Steep front-loaded | ~$0.72 / mi | Standard PM, hold |
| 40,000 – 80,000 mi | Moderate | Flattening | ~$0.85 / mi | Accelerate PM, monitor |
| 80,000 – 100,000 mi | Climbing — brakes, trans, suspension | Slow burn | ~$0.96 / mi | Begin replacement planning |
| 100,000+ mi | Severe — out-of-service risk | Minimal remaining | $1.10+ / mi | Rotate out or reassign |
Agencies that replace at the 90,000-mile inflection point typically hold lifetime TCO near $0.88. Those pushing to 120,000 miles often see the repair bucket consume the depreciation savings — and they carry higher roadside-failure risk. If your lifecycle data is scattered across paper files and group chats, walk through a live replacement-planning dashboard on your own units before the next capital request is due.
See Where You Land
Benchmark your fleet against 500+ agencies — in 30 minutes
Stop guessing whether your repair bucket is normal. Book a demo and we will run your numbers against the benchmark live, category by category, on your own fleet data.
How HVI Helps
How HVI turns police fleet cost analysis into action
Benchmarking only matters if you can act on it. HVI maps each cost bucket to a capability that closes the loop — from the roadside inspection to the shop work order to the capital plan.
Digital DVIR with instant defect-to-work-order
Every officer inspection becomes a timestamped, photo-backed record. A flagged brake issue generates a work order before the car leaves the lot — cutting the repair-to-failure window that inflates your $0.15/mi repair bucket.
Preventive maintenance by miles, hours or date
Schedule PM by odometer, engine hours or calendar — whichever fires first. Overdue alerts hit the shop foreman's phone, so the 30,000-mile transmission service does not quietly slip three weeks and become a rebuild.
Cost-per-asset analytics and benchmark reporting
See TCO per unit, per category and per shop in real time. When the chief asks why Unit 214 costs $1.12/mi, you have the answer in three clicks — not three days of spreadsheet archaeology.
Audit-ready records for DOT, insurance and council
Every inspection, repair and PM event is logged with a timestamp and photo. Insurance renewals, council budget hearings and internal audits become a search-and-export job instead of a binder hunt.
Before & After
Paper binder vs. HVI: what changes when cost data is live
The gap between a paper-based shop and a connected one is not about technology for its own sake — it is about how fast you can see a problem, act on it and prove you did.
- PM intervals tracked on a whiteboard — units fall through on shift rotations
- Defect photos live in an officer's personal phone, unattached to the unit record
- Repair costs buried in accounting, not visible to the shop foreman in real time
- Capital replacement decided by odometer guess and gut feel
- Audit prep means two weeks of photocopying binders
- PM alerts fire automatically by miles, hours or date — zero units missed
- Defects captured with photo and GPS in the app, converted to work orders instantly
- Cost-per-asset dashboard live on the shop foreman's tablet, updated daily
- Replacement candidates ranked by rising TCO trend, not just mileage
- Audit response is a filtered export — timestamped, photo-backed, done in minutes
If your shop still runs on paper DVIRs and shared spreadsheets, see the HVI workflow on your own fleet in a 30-minute demo and judge the difference for yourself.
Payback Snapshot
What a 40-cruiser fleet saves in the first year
A mini worked example using the benchmark numbers. Your mileage will vary, but the leverage points — PM compliance, repair deflection and downtime reduction — are consistent across agencies.
Moving from 78% to 96% on-time PM defers an estimated 8 major repairs at $2,300 each.
Faster defect-to-work-order flow cuts 75 downtime days at $300/day backfill and overtime cost.
Cross-shop visibility eliminates duplicate stock and emergency parts orders across three substations.
Roughly $0.04/mi pulled out of the TCO — dropping a 40-unit fleet from $0.88 to about $0.84/mi.
Key Takeaways
Police fleet TCO: what to do with this number
Measure before you cut. You cannot defend a budget or a replacement levy without a per-mile number broken into all six buckets. If you only know the total, you are negotiating blind.
Depreciation is the biggest lever — but repairs are the fastest. You cannot change residual value this year, but you can cut repair spend by lifting PM compliance from 78% to 95%+ in a quarter.
Replace at the inflection point. The 90,000-mile mark is where repair cost curves cross depreciation savings for most pursuit-rated sedans. Running longer feels cheaper and costs more.
Connect inspection to action. A paper DVIR that sits in a binder for a week is a liability, not a record. Digital defect-to-work-order is where the real money moves.
Benchmark continuously. The $0.88/mi figure is the 2026 average — your job is to know whether you sit above or below it, and why. Start tracking your own benchmark free and stop relying on last year's spreadsheet.
"We were running $0.94 a mile and blaming the cars. Turns out our PM compliance was sitting at 74 percent because nobody owned the whiteboard on night shift. Once we put the alerts on the foreman's phone, repair spend dropped inside one budget cycle. The number I personally watch now is overdue PM count — if it is above five on a Monday morning, I have a problem before Friday."
— David Keller, Fleet Maintenance Supervisor, County Sheriff's Office (mixed patrol & transport fleet, 58 vehicles)
FAQ
Police fleet TCO and cost-per-mile: what fleet managers ask
What is the average cost per mile for a police patrol car in 2026?
The 2026 benchmark across 500+ agencies is $0.88 per mile, broken down as fuel $0.18, PM $0.11, repairs $0.15, depreciation $0.32, insurance $0.09 and downtime $0.03. This is roughly 42% higher than a civilian sedan in commercial fleet service, driven by pursuit-severe duty cycles, idle hours and early replacement. You can book a demo to benchmark your fleet against this figure using your own data.
Why is police fleet TCO so much higher than civilian fleet cost?
Three factors drive most of the gap: pursuit-rated drivetrain and suspension components wear faster under hard acceleration and braking; extended idle hours on scene and surveillance burn fuel without adding miles; and depreciation accelerates because agencies typically retire cruisers at 80,000-100,000 miles instead of 150,000+. Together these push repair, fuel and depreciation buckets well above civilian baselines.
How often should a police cruiser be replaced?
Most agencies hit the cost inflection point between 80,000 and 100,000 miles. Beyond that, repair costs — particularly transmissions, brakes and electrical — climb faster than depreciation savings. The optimal replacement point depends on your specific duty cycle, but the data consistently shows that pushing to 120,000 miles rarely saves money once downtime and backfill costs are included.
What is the biggest controllable cost in a law enforcement fleet budget?
Repair spend is the most controllable bucket in the short term. Depreciation is locked in at purchase, but repairs respond quickly to PM compliance — moving from 75% to 95% on-time preventive maintenance typically defers enough major repairs to pull $0.03 to $0.05 per mile out of the TCO within a single budget cycle.
How does HVI help reduce police fleet total cost of ownership?
HVI connects digital DVIR and defect capture directly to work orders, automates PM scheduling by miles/hours/date with overdue alerts, provides live cost-per-asset analytics and maintains audit-ready photo-backed records. Together these capabilities lift PM compliance, shorten downtime and give you the per-category visibility needed to defend and reduce your TCO. See it running on your own units in a 30-minute demo.
Start Driving Your Number Down
See HVI running on your own fleet — book a 30-minute demo
We will load your units, walk through the benchmark against your real numbers and show you exactly where the leaks are. No slide deck, no sales pitch — just your fleet in the software.
Free to start — Works on any phone — No card needed