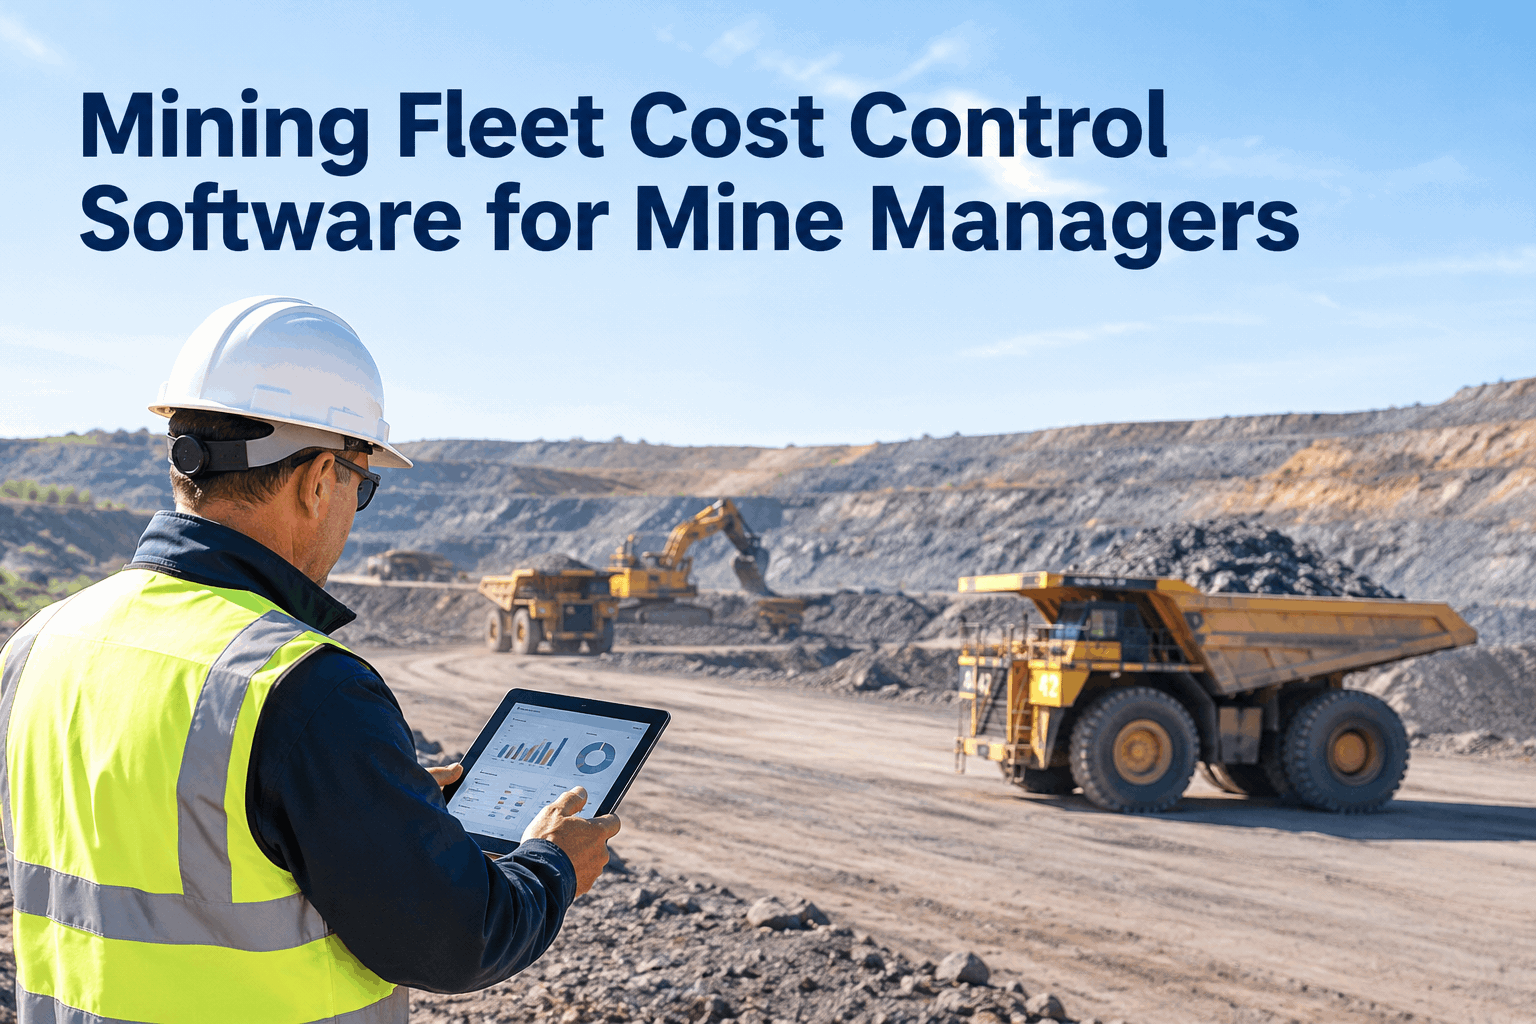
You're accountable for the fleet's cost and availability — but the data to prove either one is scattered across a fuel-card portal, a maintenance binder, three supervisors' spreadsheets, and a telematics screen nobody checks. Mining fleet cost control for a mine manager isn't about turning wrenches; it's about seeing the whole fleet clearly enough to decide, budget, and answer to leadership. This page is about getting that single view. Then book a demo to see your fleet on one dashboard .
See the Whole Fleet. Decide With Numbers, Not Hunches.
Cost per hour, availability, overdue PM, and open defects across every haul truck, shovel, loader, and drill — one dashboard a mine manager can actually run the operation from.
The gap between a well-run mine and an undermanaged one isn't the machines — it's the visibility. Industry-average fleets sit at 78–82% availability; best-in-class run 92–95%. Average maintenance cost per ton is $2.50–$3.80; best-in-class is $1.20–$1.80. The difference is rarely a secret failure. It's that the manager of the better operation can see cost, downtime, and upcoming work on one screen and act on it, while the other is reconstructing last month from four systems after the overrun already happened. Cost control starts with seeing.
The questions you can't answer todaywhat scattered data hides from a mine manager — and what it costs
Every one of these is a question a mine manager should be able to answer in seconds. When the data lives in separate systems, each one takes a day of digging — or goes unanswered until it shows up as a budget overrun.
Answering these isn't a reporting luxury — it's the core of the job. HVI's analytics and reporting dashboard pulls inspection, work order, PM, parts, and fuel data into one place so these questions have answers you can act on today. Book a demo to see your own fleet's numbers surfaced
The four numbers a mine manager runs onthe KPIs that tell you whether the fleet is winning or bleeding
You don't need fifty metrics. You need four, trended, across the whole fleet — and the honest benchmark to measure each against. Here's where average operations sit versus best-in-class, and why the gap is management, not machines.
That last row is the lever. Sites without a digital maintenance system run 40–55% of their work reactively; sites with one run 15–20% — and since an emergency repair costs roughly 4.8× the same job planned, moving that ratio is where the cost-per-ton gap closes. The dashboard is how a manager watches it move. Start a free trial and see your reactive-vs-planned split
The decisions it actually unlockswhat visibility lets a mine manager do that a spreadsheet never could
Visibility isn't the goal — better decisions are. Here's what a manager does differently once cost, downtime, and maintenance all roll up to one place.
Repair or replace, with evidence
When a machine's cost per hour climbs past the fleet and keeps rising, the replace decision stops being a gut call. You take a trended curve to leadership instead of an opinion.
Defend — and build — the budget
Real cost-per-asset history turns budget season from guesswork into a defensible number. When finance asks why maintenance is up, you have the machine-level answer.
Attack the reactive-work ratio
See how much of your maintenance is emergency vs. planned, and watch it shift as PM compliance improves — the single biggest driver of cost per ton.
Compare crews, shifts & sites
The same machine costs more on one crew than another. Ranked data makes the coaching conversation specific — and fair — instead of a vague "watch the fuel."
Each of these runs on the same underlying records — inspections becoming work orders, PM firing on meter hours, parts and fuel logged per asset. The manager's view is just that data, rolled up. Book a demo to see the decisions mapped to your fleet
How the shop floor becomes your dashboardthe data a mine manager sees starts as a fitter's inspection
The dashboard isn't separate data entry — it's the by-product of work your crews already do. Every inspection, work order, and part used flows up into the number you report on. Nobody fills in a spreadsheet twice.
-
1
Crews inspect on mobile
Operators and fitters run digital inspections per machine, flagging defects with photos — the raw signal, captured at the source.
-
2
Defects become work orders
Flagged findings convert to tracked work with parts and labor attached, so every repair's cost lands against the right asset automatically.
-
3
PM, fuel & hours roll in
Meter hours, fuel logs, and scheduled PM all attach to the same machine record — the full operating cost, not just repairs.
-
4
It surfaces as your dashboard
Cost per hour, availability, overdue PM, and open defects roll up across the fleet — the manager's view, built from the shop's actual work, live.
The mine manager's fleet-control checklistwhat you should be able to see at any moment — and most managers can't
Measure your current setup against this. Every box you can't tick today is a blind spot where cost and risk accumulate without warning — and exactly what a connected system is built to close.
If you can't tick most of these without opening four systems, that's the blind spot the overruns hide in — and the gap this is built to close. Book a demo and see your fleet-control view on one screen
From a mine manager who stopped flying blind
My monthly fleet review used to start three days early, because that's how long it took the team to pull fuel from one place, repairs from another, and hours from the operators' sheets. By the time I had a picture, it was last month's picture, and the overrun had already happened.
Now I open one screen the morning of the review. Cost per truck, availability, what PM's overdue — it's just there. The first month, two haul trucks jumped out as cost outliers that had been averaging into the fleet for a year. That's not a software feature I can put a number on easily — it's the difference between managing the fleet and reporting on it after the fact.
What fleet visibility is worththe management case for one connected view across the mine
Frequently asked questions
What does mining fleet cost control software do for a mine manager?
It rolls inspection, maintenance, parts, fuel, and downtime into one fleet view, so you see cost per hour, availability, overdue PM, and open defects across every asset on one screen. Book a demo to see it on your fleet.
What fleet KPIs should a mine manager track?
Four matter most: availability, unplanned downtime, maintenance cost per ton, and the reactive-vs-planned maintenance ratio. Each has a clear best-in-class benchmark to measure against. See them in a demo.
How does better visibility lower fleet cost?
It surfaces cost outliers and overdue PM before they become failures, and shifts work from reactive to planned — and an emergency repair runs about 4.8× a planned one. The savings follow the visibility. Book a demo to see how.
Does it work across a mixed fleet and multiple sites?
Yes. Haul trucks, shovels, loaders, drills, and LHDs all report the same metrics, so you can compare and rank across crews, shifts, and sites from one view. Start a free trial or book a demo.
Do my crews have to do extra data entry?
No — the dashboard is built from work they already do. Inspections, work orders, and parts flow up automatically, so nobody fills in a spreadsheet twice. Book a demo to see the flow from shop floor to dashboard.
Give yourself the fleet view the job actually needs
HVI turns the inspections, work orders, parts, and fuel your crews already log into one manager's dashboard — cost per hour ranked, availability trended, overdue PM and open defects in plain sight. You stop reconstructing last month and start deciding on this one. Live in under two weeks.
- Cost per hour, ranked across the fleet
- Live availability & downtime trending
- Overdue PM & open defects in one list
- Exportable reports for leadership