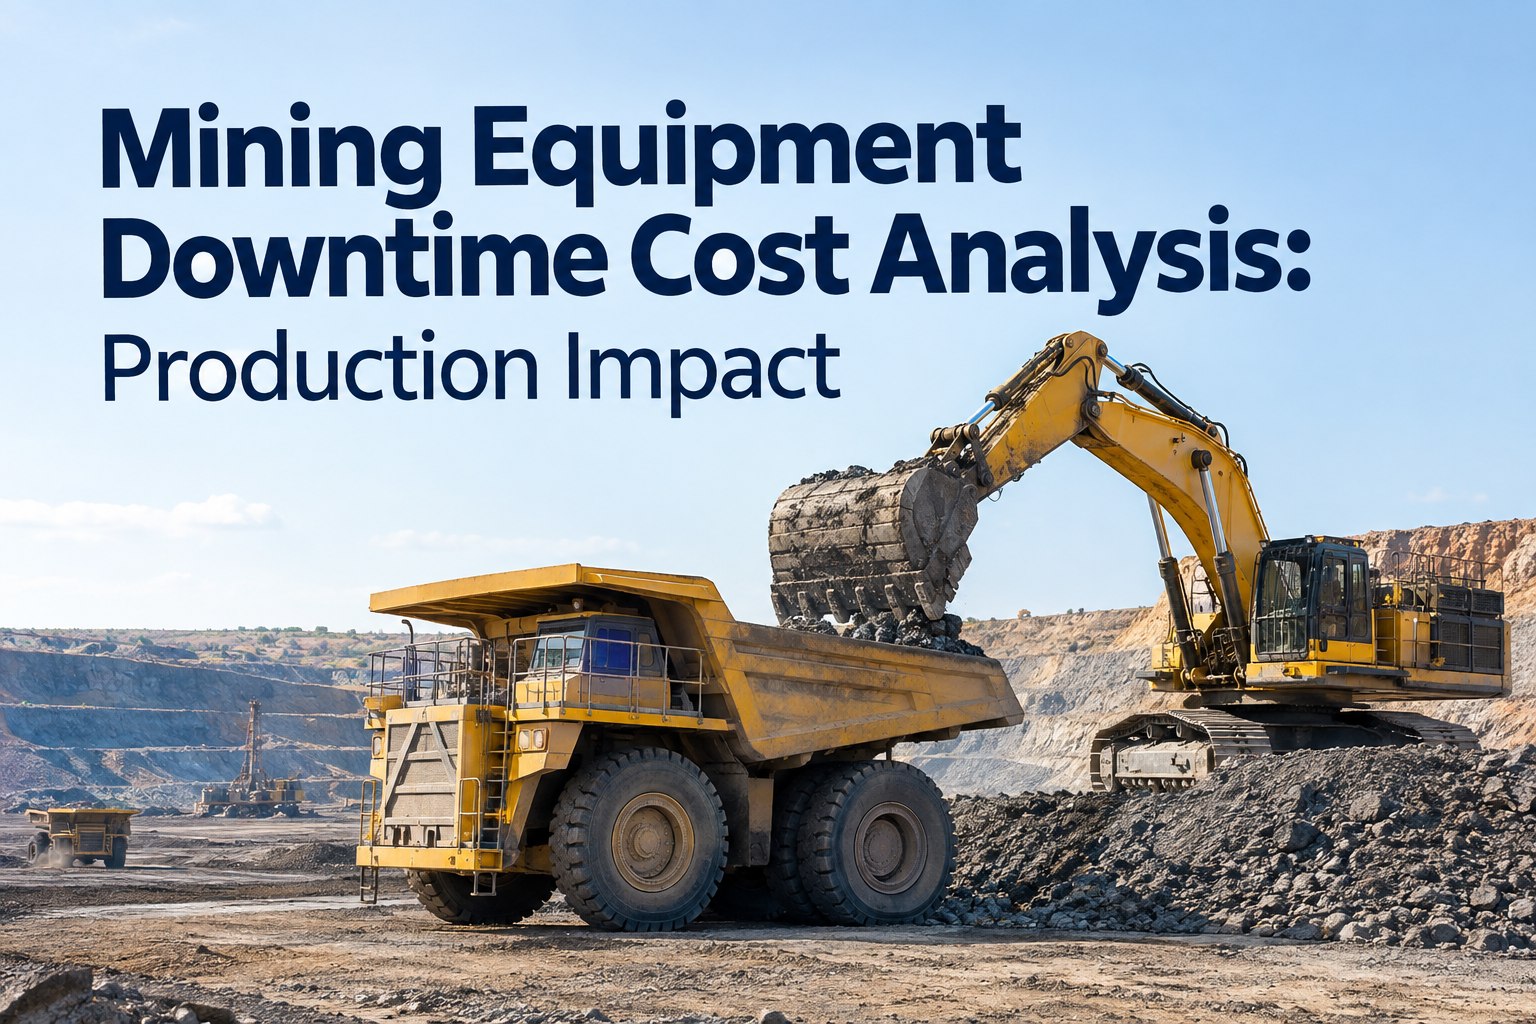
When a haul truck goes down mid-shift, the number most operations write down is the repair invoice. That number is almost always the smallest part of what the failure actually cost. Mining equipment downtime cost is dominated by lost production, idle supporting gear and schedule disruption — on an ultra-class truck, industry estimates put unplanned downtime at $5,000 to $20,000 an hour, and the repair bill is a rounding error next to that. This page shows how to build a downtime cost model that captures the whole number, not just the part that comes with a receipt. Book a demo to see it built from your records.
The invoice you can see is a fraction of what a failure took from the operation. Most of the cost hides in lost production, idle equipment and knock-on delays that never appear on a work order.
Here's the trap: the repair cost is the one number that arrives neatly, with an invoice attached, so it's the one that gets recorded — and the one everyone anchors to. The far larger costs arrive with no paperwork at all. Nobody sends you a bill for the 40 tonnes of ore that didn't move, the loader that sat idle waiting, or the three trucks that queued behind the breakdown. To make a real decision about maintenance spend, spares or reliability, you have to reconstruct those costs deliberately. This is how.
Building a Real Mining Equipment Downtime Cost Model
A credible downtime cost isn't one figure — it's a stack. Each layer is real money, and each one is invisible on the repair invoice. Add them and the true cost of a failure typically lands several times higher than the repair alone. Here are the five layers, from the one you already track to the ones you probably don't.
You don't need every layer costed to the cent. You need them all present, so the number you carry into a budget conversation reflects the failure's true weight. A model that stops at Layer 1 will always under-value maintenance — because it's comparing the full cost of prevention against a tiny fraction of the cost of failure. Book a demo to connect repair, downtime and cost records into one model
Value, revenue, margin — get this rightthe mistake that makes a downtime number impossible to defend
The fastest way to lose credibility in a budget meeting is to value lost production at full revenue. It overstates the cost, a finance lead spots it in seconds, and your whole model gets waved off. Getting the valuation basis right is what makes the number survive scrutiny.
There's one nuance worth stating: if the operation is genuinely production-constrained — every tonne you can move is a tonne you can sell, and you're selling everything you produce — then lost tonnes are lost sales, and the margin loss is real and permanent. If you can catch up the lost production later, the true cost is closer to the extra cost of catching up (overtime, deferred work) than the full margin. A defensible model states which case you're in. That honesty is exactly what earns the number its authority. Start free and track the maintenance costs that feed the model
The cascade: one failure, a whole chain stopswhy a breakdown on a loading or hauling asset costs more than its own downtime
Mining is a connected cycle: dig, load, haul, dump, crush, process. When a link in that chain fails, the cost doesn't stay with the failed machine — it spreads to everything up and down the line within minutes. A haul truck failure doesn't cost one truck; it backs up the loader behind it and starves the crusher ahead of it.
This is why some industry estimates put the total impact of a haul truck failure well above its own hourly rate once the cascade is counted — the disruption spreads through the whole haulage cycle. Trucks queue, loaders lose rhythm, and production flow turns uneven long after the failed unit is fixed. A downtime model that only counts the failed asset's own hours misses most of the damage. To capture it, you have to know which assets were connected to the one that stopped — and the timestamps that show how long each sat idle. Book a demo to trend downtime and its knock-on effects
Not all mining equipment downtime cost is equalan hour lost on a constraint asset costs far more than an hour lost anywhere else
The single most important idea in downtime economics: the cost of a stoppage depends entirely on whether the asset is a bottleneck. Downtime on the constraint — the machine that sets the pace of the whole operation — is lost production you can never recover. Downtime on a non-constraint asset with spare capacity behind it may cost almost nothing, because the system absorbs it.
Constraint / bottleneck asset
The primary crusher, the only loader on a face, the single haul road. When it's down, the whole operation's output drops one-for-one. Every hour lost here is production the mine can never make up.
Non-constraint asset with redundancy
One truck in a fleet of twenty when the crusher is the limit, or a machine with a standby unit ready. The system has slack to absorb the loss, so the production hit is small or zero — only the repair cost is real.
The practical consequence is huge: this is how you prioritise maintenance spend and spares. A dollar of reliability investment on the constraint asset returns far more than the same dollar spent on a redundant one. If your downtime model treats every hour of downtime as equal, it will send your maintenance budget to the wrong machines. Mapping which assets are constraints — and watching their availability hardest — is where a downtime program actually pays for itself. Start free and flag your constraint assets for closest tracking
The unglamorous part: classification and timestamp discipline
None of this works without clean inputs, and clean inputs come down to two habits. First, classify states consistently: downtime (the asset can't work when it's needed) is not standby (available but not required this shift) is not planned maintenance (scheduled, expected, budgeted). Lumping these together makes availability look worse than it is and buries the failures that actually hurt. Second, capture honest timestamps: when the asset went down and when it truly returned to production — not when the repair finished, which can be hours before the machine is back in the cycle. Get those two habits right and the cost model builds itself from records you're already creating. Get them wrong and every number downstream is guesswork.
From a maintenance manager who rebuilt the business case
For years I asked for more preventive maintenance budget and kept getting told the repair costs didn't justify it. Of course they didn't — I was only counting repair costs. The day I put a real downtime number in front of the GM, using the actual timestamps from our work orders and the margin on the tonnes we lost, the conversation changed completely.
One transmission failure on our primary loader wasn't a $40,000 repair. Once you counted the trucks queued behind it and the crusher running half-fed for a shift, it was closer to a quarter of a million. Nobody argued about the PM budget after that. The trick wasn't better maintenance — it was finally measuring what the failures were actually costing us.
Frequently asked questions
How do you calculate the true cost of mining equipment downtime?
You build it in layers, because the repair invoice is only the smallest one. Start with the direct repair cost (parts and labour), then add the lost production valued at margin rather than revenue, the operating cost of idle upstream and downstream equipment that sat waiting, idle operator and crew wages plus any emergency mobilisation of a field crew or parts, and finally the schedule consequences like missed targets or contract penalties. A common way to express the production layer is lost output per hour multiplied by the contribution margin per unit, multiplied by the downtime duration. The total almost always lands several times higher than the repair bill alone — which is exactly why operations that measure only the invoice consistently under-value maintenance. The goal isn't cent-perfect precision on every layer; it's making sure every layer is present so the number reflects the failure's real weight when you take it into a budget decision.
Should lost production be valued at revenue or margin?
Margin, in almost every case — and getting this wrong is the fastest way to have your downtime model dismissed. Valuing lost tonnes at full sale price (revenue) overstates the loss, because you never incurred the variable cost of producing ore you didn't produce. The money genuinely lost is the contribution margin: revenue minus the variable cost you would have spent moving that ore. There's an important nuance, though. If the operation is production-constrained — you sell every tonne you can move — then lost tonnes are permanently lost sales and the full margin loss is real. If you can catch up the lost production later in the schedule, the true cost is closer to the extra cost of catching up, such as overtime and deferred work, than the full margin. A credible model states which situation applies rather than defaulting to the biggest possible number, and that restraint is what makes finance take it seriously.
What is the cascade effect in mining downtime?
The cascade effect is how a failure on one asset spreads cost to the connected assets up and down the mining cycle. Mining runs as a chain — dig, load, haul, dump, crush, process — so when one link stops, the others can't do their job either. A haul truck that fails mid-shift leaves the loader behind it with nowhere to tip, starves the crusher ahead of it of feed, and forces the other trucks in the cycle to queue or re-route. Within minutes, a single mechanical failure becomes a system-wide production loss far larger than the failed machine's own hourly cost. This is why measuring only the downtime hours of the asset that broke understates the real impact, sometimes dramatically. To capture the cascade you need to know which assets were connected to the one that stopped and how long each was disrupted, which comes back to disciplined downtime records with accurate timestamps for when each machine went idle and resumed.
Why does downtime on a bottleneck asset cost more?
Because the bottleneck — the constraint asset — sets the pace of the entire operation, so an hour lost there is an hour of production the whole mine can never recover. If your primary crusher, sole loader on a face, or single haul road goes down, output drops one-for-one with the downtime; nothing else can compensate. By contrast, downtime on a non-constraint asset that has redundancy or spare capacity behind it may cost little more than the repair, because the system has slack to absorb the loss — one truck down in a fleet of twenty, when the crusher is the real limit, barely moves total production. This distinction is the key to prioritising maintenance and spares: a dollar of reliability investment on the constraint returns far more than the same dollar on a redundant asset. A downtime model that treats every hour as equal will misdirect the maintenance budget, which is why identifying and watching your constraint assets most closely matters so much.
How can downtime data justify a maintenance investment?
By replacing the repair-invoice number with the full cost of failure, which shifts the entire business case. Maintenance investment loses every time it's compared against repair costs alone, because prevention looks expensive next to a small invoice; it wins when compared against the true, layered cost of the failures it prevents. The way to build that case is to connect defect and work-order timestamps (which tell you exactly when assets went down and came back) with the maintenance spend on each asset and the production value lost during the stoppage. Trend those over time and the pattern of high-cost, recurring failures becomes visible — and each one is a concrete target for a spare-parts decision, a reliability project, or a tightened PM interval. HVI supports this directly: timestamped defect and work-order records feed the duration side, Analytics classifies and trends the events, and Expense Track and Cost Analysis tie spend to performance per asset. You can book a demo to see those inputs assembled into a defensible case.
Stop pricing downtime at the repair invoice
HVI connects timestamped defect and work-order records with downtime, maintenance spend and analytics — so you can see the full cost of a failure, spot the high-cost recurring ones, and build a maintenance business case that finance can't wave off. The invoice was never the number that mattered.
Timestamped records · Cost analytics · Per-asset trending from day one