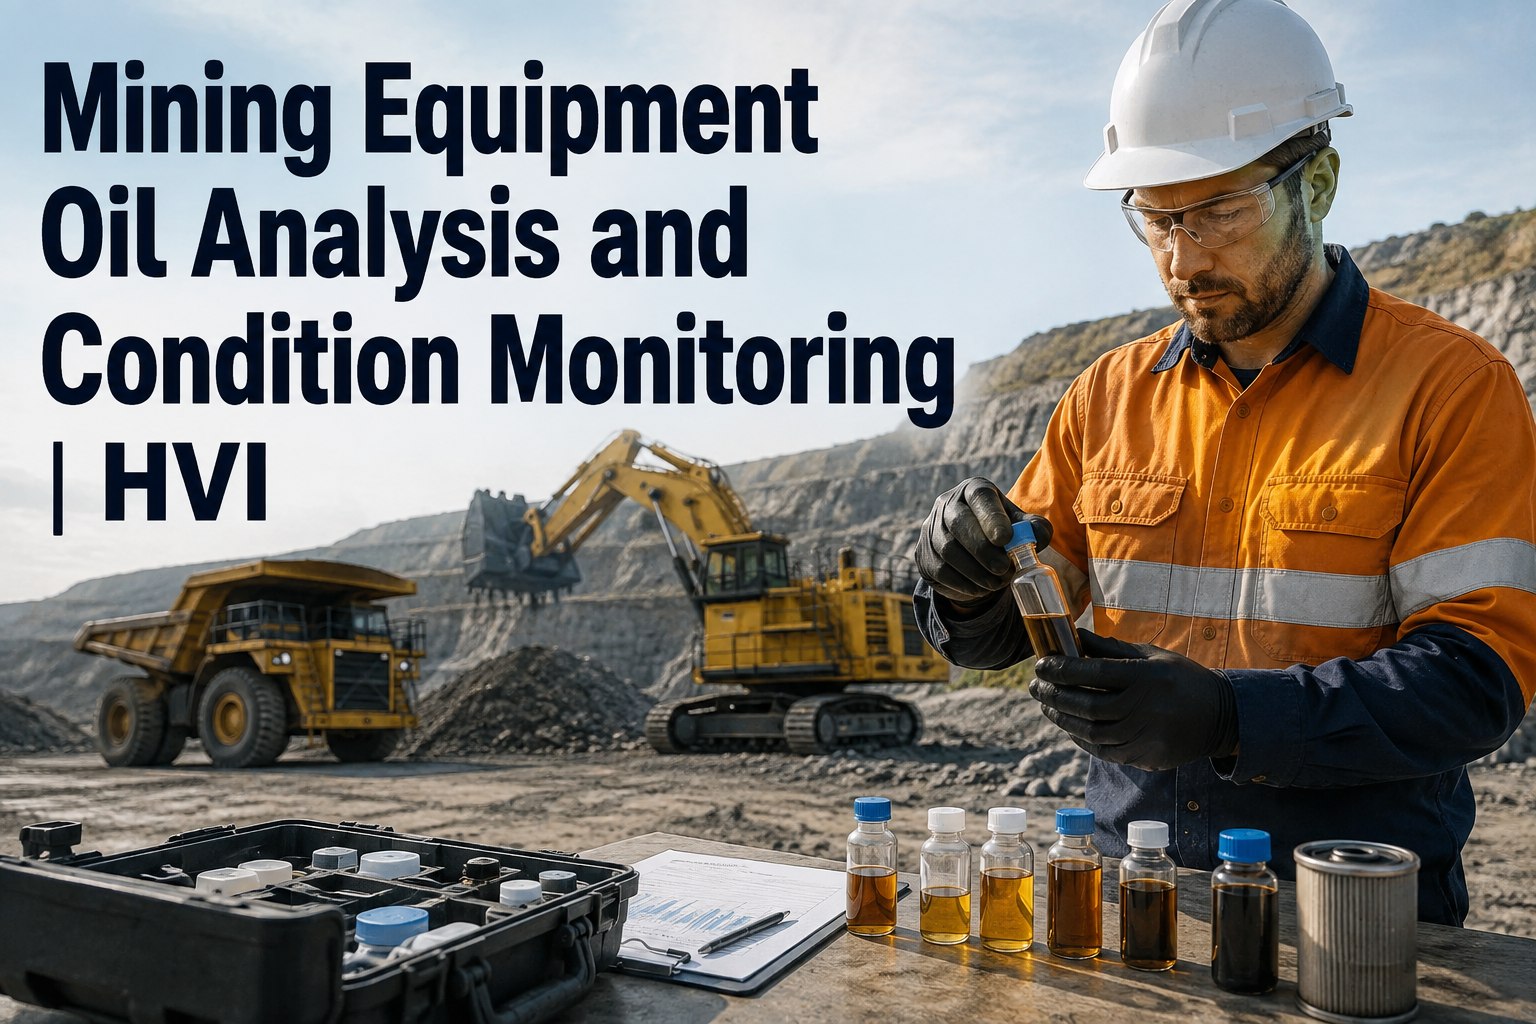
Your haul truck's final drive is shedding metal right now, and the only way you'll know about it three weeks before it seizes is a 60-millilitre bottle of oil. That's the whole promise of mining oil analysis and condition monitoring: wear metals and contamination trends give you weeks of warning before a component fails, but only if the sample that reaches the lab actually represents what's circulating inside the machine. Most sites already pay for an oil analysis programme. Far fewer get the value out of it, because a sample pulled from a drain pan, taken cold, or logged against the wrong asset turns a predictive tool into an expensive ritual. This page breaks down the sampling discipline that makes the lab cost worth it, the indicators that actually matter, how to read trends instead of panicking over single results, and how to wire the whole programme into your CMMS so a rising iron count automatically becomes a planned work order instead of a Friday-night failure. If you'd rather see the workflow on your own fleet than read about it, you can book a 30-minute walkthrough of oil analysis tracking in HVI and bring your toughest component questions.
Is your oil analysis programme predicting failures, or just filing reports?
Nearly every mine samples oil. Far fewer sample it the same way, at the same point, at operating temperature, every single interval — and that consistency is the only thing that makes wear metal trending valid. Fix the discipline and the data starts earning its keep.
The cost gap between a good and a sloppy oil sampling programme
Condition monitoring in mining pays for itself on a single caught failure. These are the numbers your controller will ask about when you defend the programme internally.
Oil sampling technique: the four rules that make trending valid
A lab can only analyse what you hand it. These four rules decide whether your sample represents the machine — or the bottom of a drain pan.
Same sample point, every time
Fit dedicated sampling valves on engines, hydraulics, transmissions and final drives, and label them per asset. A sample pulled from a different location each interval measures plumbing geography, not component wear. Consistency of where is what makes the trend line mean anything at all.
Sample at operating temperature
Pull the sample while the machine is at working temperature, ideally under load or just off it. Cold oil lets wear debris and water settle out, so the lab sees a artificially clean picture. A warm, circulating system keeps particles suspended where the bottle can catch them.
Mid-stream extraction only
Flush the valve or line first, then fill the bottle mid-stream without touching the port. The first rush of oil carries debris sitting in the valve body; the last of the stream risks pulling from stagnant pockets. Mid-stream is the only window that reflects what the bearings are actually bathing in.
Never take drain samples
Drain-pan oil concentrates everything that settled since the last service — metal, dirt, water, old additive fallout. It will flag a healthy component as dying and wreck your baseline. If a machine has no live sample port, fitting one costs less than a single misdiagnosed component change-out.
The wear metal and contamination indicators that actually matter
A standard mining fluid analysis report runs dozens of tests. These are the ones that should drive a decision, and what each one is whispering about your component.
| Indicator | What a rising trend usually means | Typical action trigger |
|---|---|---|
| Iron (Fe) | General wear from cylinders, gears, shafts — the baseline wear metal for most components | Sustained climb across 2–3 consecutive samples, not one spike |
| Copper (Cu) | Bearing cages, bushings, oil cooler cores; often appears with lead in bearing wear | Copper rising alongside iron points at a specific bearing set |
| Aluminium (Al) | Piston scuffing, pump housings, torque converter wear depending on compartment | Sharp jump after a dust event or known overheat |
| Silicon (Si) | Dirt ingestion — air intake leaks, poor sealing, dusty fill practices | Any elevation: find the entry point before it grinds the rest |
| Viscosity shift | Fuel dilution (thinning) or oxidation and soot loading (thickening) | ± change beyond grade band — check injectors or drain interval |
| Water | Coolant leak, condensation, wash-down ingress; kills film strength fast | Any positive result on a critical component gets investigated same week |
| Particle count (ISO code) | Overall cleanliness of hydraulics; the single best predictor of hydraulic valve and pump life | One ISO code step worse than target triggers filtration review |
Coolant analysis belongs in the same programme: glycol in oil is a top-three engine killer on site, and a routine coolant panel catches liner pitting and additive depletion before they become an in-frame. If you want to see how these results sit against each asset's full history, book a demo and we'll trend a real wear-metal history live.
Trend the line, don't react to the dot
The most expensive habit in oil analysis is treating every abnormal result as an emergency — or every normal one as a clean bill of health. Interpretation is trend reading.
Single-result reaction
- One high iron reading triggers a panic teardown of a healthy final drive
- One clean report after a resample "clears" a component that is genuinely wearing
- Lab comments read in isolation, with no memory of the last six samples
- Every flagged result becomes a shouting match between maintenance and operations
Trend-based interpretation
- Three consecutive rising points set the alarm — one point sets a resample
- Rate of change matters more than the absolute number against a generic limit
- Each asset builds its own baseline; a 785 and a 730E wear differently by design
- Flags land as planned work orders with parts on hand, not breakdown callouts
A wheel loader's transmission shows iron at 85 ppm, then 110, then 145 across three monthly samples. None of those numbers alone breaches the generic lab limit of 180. But the rate of climb — roughly 30 ppm per interval — says a gear set is wearing. You schedule the reseal during a planned down day: two technicians, one shift, parts kitted in advance. Ignored for two more intervals, the same wear becomes a failed transmission at the face, a recovery job, and a production unit down for the better part of a week waiting on a reman exchange. The lab fee for those three samples was under $150. The difference in outcomes is measured in tens of thousands.
Define what happens at each threshold — before the report lands
An oil analysis programme without a written action protocol is just a subscription to bad news. Every severity level needs a pre-agreed response, an owner, and a deadline.
Green — continue and record
Result files against the asset, the trend chart updates, and the next sample is already scheduled at the correct meter interval. No human decision needed — the system carries the routine.
Amber — resample and inspect
One abnormal indicator triggers a resample at half the normal interval plus a physical check: filters cut open, breathers inspected, magnetic plugs read. A work order is raised so the follow-up can't evaporate into a busy week.
Red — restrict and plan the repair
Confirmed severe wear or contamination moves the unit to restricted duty and a planned component change-out is scheduled with parts, labour and downtime window agreed with operations. The repair happens on your calendar, not the failure's.
This is where most paper-based programmes die: the lab emails a PDF, it sits in an inbox, and the amber becomes a red becomes a breakdown. When results live inside your CMMS, a flagged sample can generate its own work order the day it lands — start free and wire that up this week.
See your wear-metal trends next to your work orders — in one screen
Bring a recent lab report to a 30-minute demo and we'll show you how HVI attaches results per asset, trends them, and turns a flag into a scheduled repair.
Condition monitoring in mining works best as a trio
Oil analysis rarely acts alone on a mature site. Combined with vibration and thermography, each technology covers the others' blind spots — and all three should feed the same asset record.
Oil analysis
Sees inside closed compartments — engines, hydraulics, gearboxes, final drives. Catches wear and contamination weeks before noise or heat appears. Cheapest per test, slowest to result.
Vibration analysis
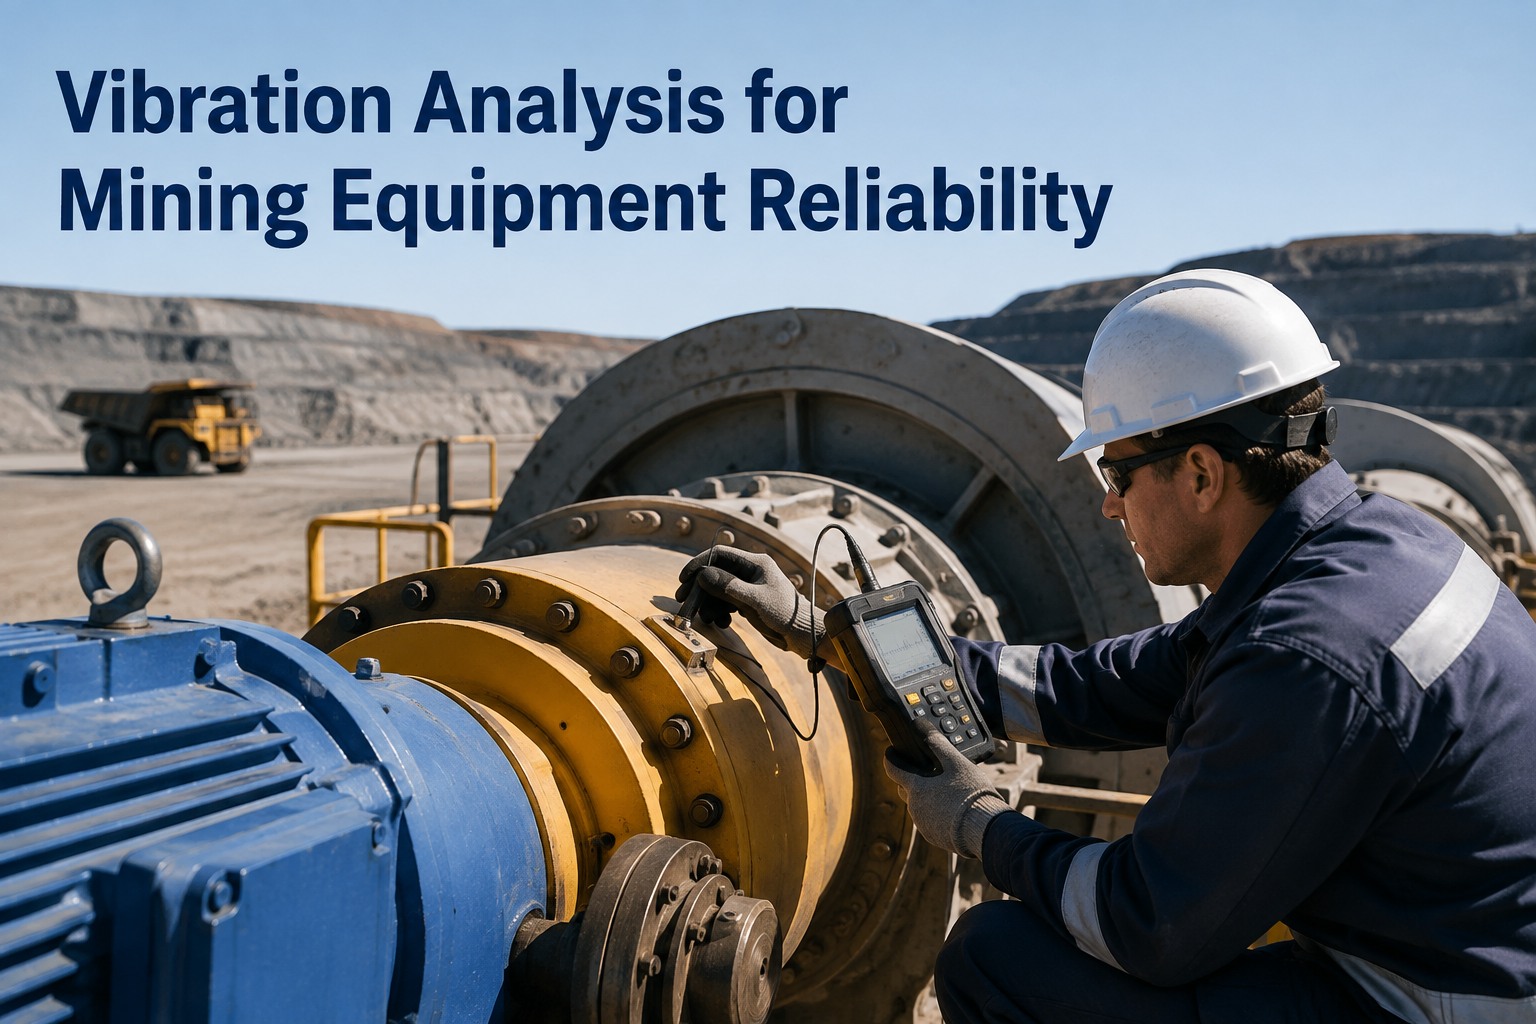
Pinpoints imbalance, misalignment and bearing faults on rotating plant — crushers, conveyors, pumps, fans. Confirms where a rising wear-metal trend is physically coming from.
Thermography
Finds hot bearings, failing electrical connections and blocked cooling paths without touching the machine. The fast screening layer between scheduled oil and vibration routes.
When a final drive shows rising copper and a vibration route flags the same corner, you stop debating and order the parts. That convergence only happens if all three data streams land on one asset timeline — which is exactly the case for running your condition monitoring inside a single CMMS demo rather than three separate spreadsheets.
Oil analysis tracking built into your maintenance workflow
HVI (Heavy Vehicle Inspection & Maintenance, by JRS Innovation Inc.) is the cloud + mobile CMMS that keeps sampling, results and follow-up repairs on the same asset record your inspections and work orders already live on.
Results attached per asset
Every lab report files against the exact unit and compartment, with photos of the bottle label and sample point. No more hunting inboxes for "that PDF from March" during a failure review.
PM triggers at the right meter
Preventive maintenance schedules fire sampling tasks at the correct engine-hour or mileage interval, with due and overdue alerts — so intervals stop drifting when the pit gets busy.
Full sample history in the Logbook
The complete sampling life of every component sits in one audit-ready timeline — timestamped, photo-backed and exportable for client, insurer or internal reliability reviews in seconds.
Trend visibility in Analytics
Dashboards show which compartments are climbing, which flags are open, and what each caught failure saved — the numbers you need when you defend the programme budget in a demo with your own data.
Mining oil analysis pays when the discipline holds
If you take five things from this page, take these — they're the difference between a programme that predicts failures and one that just files reports.
Technique is everything. Same point, operating temperature, mid-stream, never from the drain. Break any one rule and the trend line is fiction.
Consistency beats frequency. Monthly samples taken identically outperform weekly samples taken casually. Trending is only valid when the method never changes.
Read the slope, not the dot. Rate of change across three samples tells you more than any single result against a generic limit.
Pre-agree the actions. Green, amber, red — each with an owner, a response and a deadline, written down before the report arrives.
Close the loop in your CMMS. A flag that doesn't become a scheduled work order is a failure you chose to have. Sign up free and connect sampling to scheduling so the loop closes itself.
My gripe was never the lab — it was us. We had bottles filled from drain pans, samples logged against the wrong truck, and flags sitting in a fitter's inbox for a fortnight. I track one number now: how many days between a red flag and a booked work order. It used to be eleven. Since results land straight on the asset and generate the job automatically, it's under two, and we haven't lost a final drive to a surprise in over a year.
Mining oil analysis and condition monitoring FAQs
How often should you sample oil on mining equipment?
What does an ISO cleanliness code actually tell you?
Why are drain samples such a problem for trending?
How do I get wear-metal trends into my maintenance software?
Is oil analysis worth it for a small fleet or contractor?
Turn your next lab report into a planned repair, not a breakdown
HVI keeps sampling schedules, results, trends and follow-up work orders on one asset record — on any phone or tablet, at the shop or the face. See it running on your own fleet in 30 minutes.
Free to start — Works on any phone — No card needed