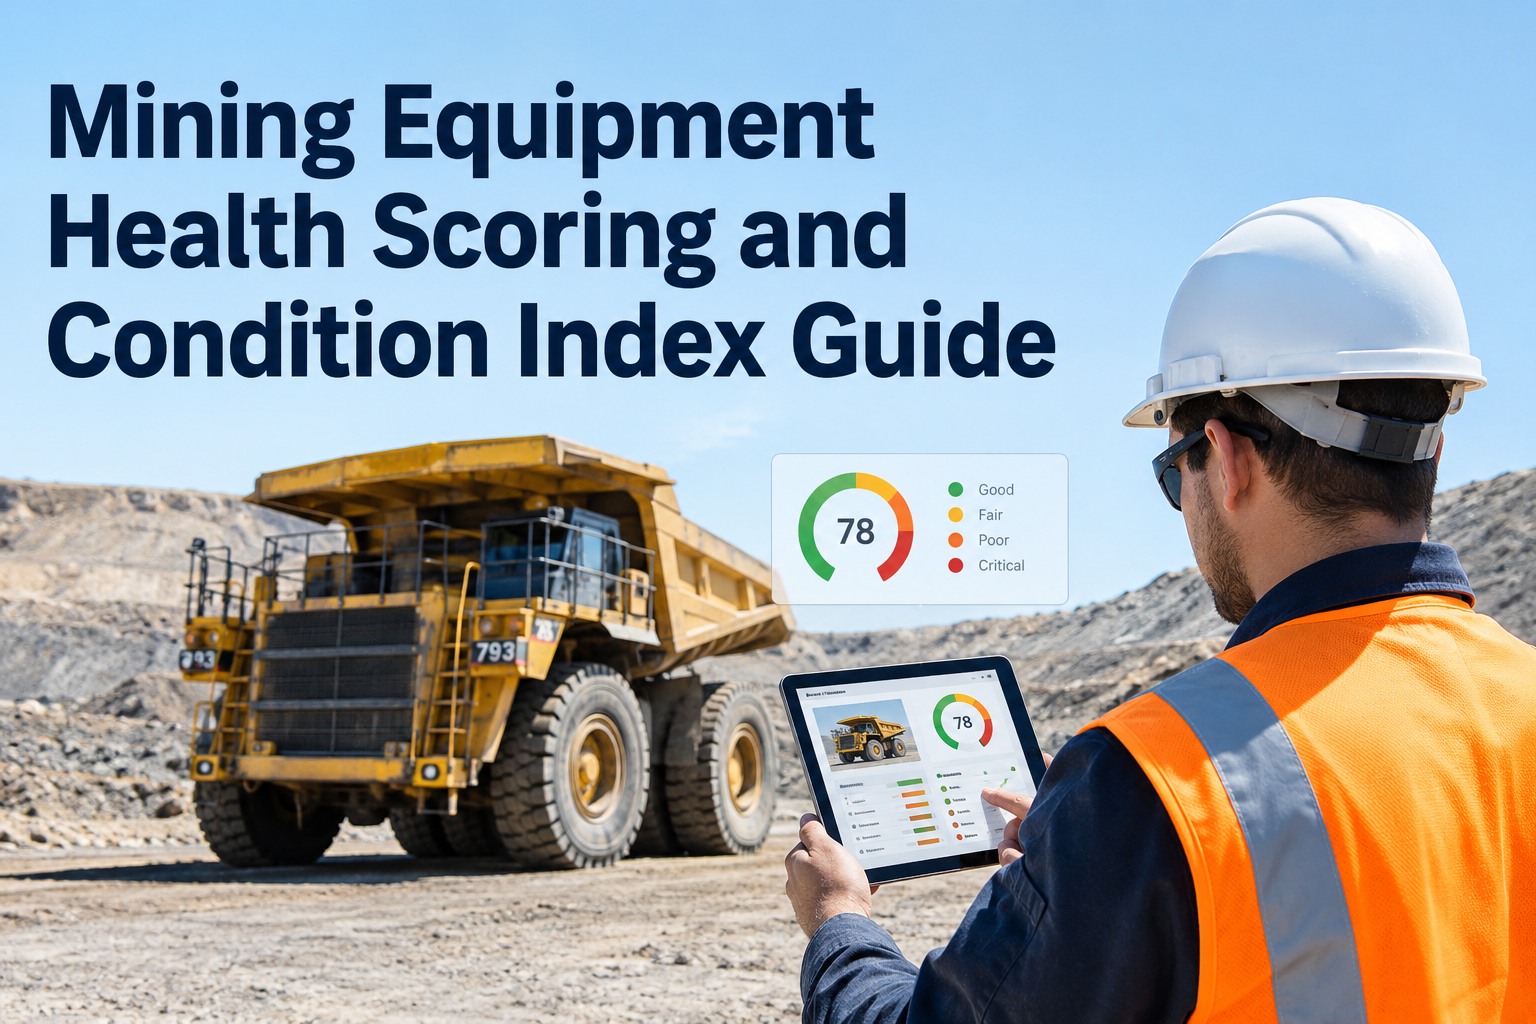
Every fleet has that one machine. It passed its walk-around Monday, the operator signed off, the board shows it green. Thursday the final drive lets go mid-shift and the haul cycle backs up behind it for six hours. Equipment health scoring exists to catch that machine on Monday — to turn the scatter of inspection defects, oil samples, meter hours and repair history into one number that tells you which asset is quietly moving toward failure while the checklist still says "pass." Done right, a health score is the shortlist your maintenance planner should be working from. Done wrong, it's a dashboard that hides risk behind a comforting green dot. This guide covers both. Book a demo to see it on your own asset register.
What Actually Goes Into an Equipment Health Score?
A health score isn't a sensor reading. It's five streams of condition data, weighted and rolled into a single index a planner can rank a fleet by.
A composite equipment health score gives a maintenance planner something a spreadsheet of raw readings never will: a single, comparable, fleet-wide ranking of which asset needs attention first. But the number is only as honest as the data underneath it — and only useful when it points a human toward a decision, not away from one. Here's how to build one that earns its place on the wall, and where teams go wrong.
0–100what an equipment health score actually means
An equipment health score is a composite number that summarises how close an asset is to needing intervention, built by combining several condition indicators into one value. It's a leading indicator — it should fall before a breakdown, giving you warning — not a lagging production metric that only confirms the failure after it happened. Most systems land on a 0–100 scale (or a simpler 1–5 band, long used by utilities to convert inspection findings into repair priorities). What matters isn't the scale, it's the banding: a score is only actionable if every level maps to a defined action.
The value of collapsing all of that into one banded number is speed of decision. Instead of a planner reading twelve separate condition attributes per machine across a 40-unit fleet, they read one ranked list and start at the bottom. Book a demo to see banded health scores across your whole asset register
5 inputsthe data streams that build a defensible score
A health score that a superintendent will actually trust isn't a single sensor feed — it's a weighted blend of everything you already know about the machine. The weighting reflects each stream's contribution to failure risk, and it should shift by asset class: a rope shovel weights structural and drive data differently than a light utility truck. These are the five streams that make up a solid mining equipment health score.
Open defects & severity
Live, unresolved inspection findings ranked by severity. A single critical defect — a cracked frame weld, a failing brake circuit — should drag a score down hard on its own, regardless of everything else looking fine.
Condition-monitoring data
Oil analysis, vibration and temperature trends from OEM telematics or lab samples. The most forward-looking stream — rising iron in the oil or a climbing bearing temperature flags wear weeks before it becomes a visible fault.
PM compliance & overdue tasks
How current the machine is against its preventive maintenance schedule. Overdue services and skipped intervals raise failure probability — a machine 200 hours past a major service is carrying invisible risk the defect log hasn't caught yet.
Repair & failure history
Frequency and pattern of past breakdowns. An asset that's failed the same component twice this quarter is telling you something a one-time reading can't — recurring failures are the strongest signal of an unresolved root cause.
Age & meter hours vs. life
Where the machine sits against expected component life. Mining assets run 5,000–7,000 hours a year — two to three times a construction machine — so age alone shifts the baseline expectation of what's about to wear out.
No single stream is the score. A machine can post clean oil samples and still score low because two critical defects are open and it's 300 hours overdue on a final-drive service. That blending — and the ability to tune the weights per asset class — is what separates a real health index from a dressed-up defect count. Start free and build scoring from your existing inspection and PM data
Then what?turning the score into a maintenance decision
A health score that nobody acts on is just decoration. The point of ranking a fleet by asset health is that the number changes what your planner does on Monday morning. Here's the workflow that connects a low score to a closed work order — the loop that makes health monitoring worth the effort.
-
1Rank the fleet, work bottom-up Sort every asset by score. The planner's week starts with the lowest — the machines closest to failure — not with whatever radioed in loudest.
-
2Open the score, read the drivers A number alone isn't enough. Drill in: is it dragged down by a critical defect, an oil trend, or three overdue PMs? The why decides the fix.
-
3Schedule into the next planned window Convert the finding into a work order staged for a maintenance window — not an emergency call at 2am. Planned repairs cost a fraction of what the same job costs under breakdown pressure.
-
4Close the loop, watch the score recover Complete the work, record as-found and as-completed condition, and confirm the score climbs back into the green. A score that doesn't recover after a repair is telling you the root cause is still live.
That's the difference between condition monitoring as a report and condition monitoring as a management tool. The score points; the human decides; the work order closes the gap; the next score confirms it worked. Book a demo to see the score-to-work-order loop in one place
The trapwhere health scoring quietly goes wrong
The failure mode of health scoring isn't that the math is hard. It's that a confident-looking number invites teams to stop thinking. A score is a prioritisation aid — it should sharpen engineering judgement, never replace it. These are the three ways a well-intentioned scoring program turns into a liability, and how a transparent, inspection-backed system avoids each one. Book a demo to see how HVI keeps every score drillable and honest
Garbage in, green out
If operators rush walk-arounds and defects go unlogged, the score reads healthy on a machine that isn't. A high score built on thin data is more dangerous than no score — it manufactures false confidence. The fix is data quality at the source: fast, honest digital inspections that make logging a defect easier than skipping it.
A black-box number nobody trusts
If a planner can't see why a machine scored 48, they'll ignore the score and fall back on gut feel. Transparency is non-negotiable — every score must open into the defects, trends and overdue tasks that produced it. A number you can't interrogate is a number you can't defend to a superintendent.
Scoring instead of deciding
The most common failure: the dashboard becomes the deliverable. Scores get generated, reviewed in a meeting, and nothing changes on the shop floor. A health index only creates value when a low score reliably triggers a work order. If the loop doesn't close, you've built a very sophisticated way to watch machines fail.
From a maintenance manager who runs it daily
We resisted scoring for years — figured it was a fancy way to tell us what the crew already knew. What changed my mind was ranking. I stopped starting my day with whoever called the radio first and started with the bottom five on the board.
The one that surprised me was a dozer sitting at 51. Oil samples were clean, no big defects — but it had three overdue PMs and had eaten the same hydraulic pump twice. The score caught the pattern I'd been signing off past. We pulled it into a Saturday window instead of losing it mid-week. The number's only useful because I can open it and see the four things dragging it down. If it were just a color, I'd have ignored it like everyone ignores a dashboard.
The takeaway
Equipment health scoring works when it blends five weighted data streams — defects, condition data, PM compliance, repair history and age — into one banded, rankable index.
Every band must map to a defined action, and every score must open into the drivers behind it — a number you can't interrogate is a number nobody trusts.
The score ranks and points; the engineer decides. It sharpens judgement on which asset to work first — it never replaces the person reading the machine.
With mining unplanned downtime on a large haul truck running $5,000–$10,000 an hour (McKinsey Mining Operations Research, 2024) and emergency repairs costing several times a planned job, catching the right machine one window early is where a health score pays for itself. Build it on honest inspection data, keep it transparent, and close the loop — and the number stops being decoration and starts being the shortlist your fleet runs on. Start free and turn your inspection and PM records into a live health index
Frequently asked questions
What is an equipment health score?
An equipment health score is a composite number — usually on a 0–100 scale, sometimes a simpler 1–5 band — that summarises how close a machine is to needing intervention by combining several condition indicators into one value. Rather than reading a dozen separate metrics per asset, a maintenance planner reads one ranked figure. A good score is a leading indicator: it falls before a breakdown, giving warning, unlike a production metric that only confirms failure after it happens. The score is built by weighting inputs like open defects, oil and vibration trends, preventive maintenance compliance, repair history and meter hours, then aggregating them. Its whole purpose is to let a team rank an entire fleet by risk and start work on the assets closest to failure first, instead of reacting to whichever machine breaks down loudest.
How is a mining equipment condition index calculated?
A condition index is calculated by scoring each input stream against its normal range, weighting each by how much it contributes to failure risk, and aggregating the weighted scores into one number. A typical mining blend might weight open defects and their severity most heavily (a single critical defect can drag the score down on its own), followed by condition-monitoring data like oil analysis and vibration, then PM compliance, repair history, and finally age against expected component life. The weights are not fixed — they should shift by asset class, because a rope shovel and a light utility truck fail in different ways. The exact formula matters less than two principles: the score must be transparent enough that a planner can open it and see which inputs dragged it down, and every band on the scale must map to a defined action so the number drives a decision rather than just describing a state.
What data do I need to start health scoring my fleet?
Most fleets already have everything they need. The core inputs are digital inspection records with severity-ranked defects, preventive maintenance history showing what's current and what's overdue, work-order and repair history, and meter or hour readings per asset. If you also have condition-monitoring data — oil sample results, vibration readings, or OEM telematics like Cat MineStar or Komatsu KOMTRAX — that strengthens the forward-looking part of the score, but you can build a genuinely useful index from inspection and PM data alone. The critical requirement isn't more sensors, it's data quality at the source: if operators rush inspections and defects go unlogged, the score reads healthy on a machine that isn't. Fast, honest digital inspections that make logging a defect easier than skipping it are the real foundation. Scoring is a lens over records you're already keeping, not a separate data-collection project.
Does a health score replace inspections or engineering judgement?
No — and treating it that way is the most common way scoring programs fail. A health score is a prioritisation aid. Its job is to rank a fleet and point the planner toward the assets that most need attention, so limited maintenance hours go to the right machine first. It does not diagnose the fault, decide the repair, or judge whether a machine is safe to run — those remain the work of the technician and the maintenance engineer reading the actual condition of the machine. The score is built from inspection data, so it depends on inspections continuing, not replacing them. The right mental model is that scoring sharpens judgement by surfacing patterns a human might miss across a large fleet — three overdue PMs on a machine with clean oil, or a component that's failed twice in a quarter — while the human still makes every real decision. A score that a team follows blindly is more dangerous than no score at all.
How does health scoring reduce downtime and cost?
It reduces downtime by shifting repairs from unplanned emergencies to scheduled maintenance windows. When a health score flags a machine trending toward failure, the team can stage parts and book the work into a planned window instead of reacting to a breakdown mid-shift. The financial gap is large: unplanned downtime on a large mining haul truck runs $5,000 to $10,000 per hour in lost haulage and production impact (McKinsey Mining Operations Research, 2024), and emergency repairs performed under pressure typically cost several times more than the same work done planned, once you factor in premium labour, expedited parts and lost production. Maintenance can represent 35–50% of a mining operation's total cost, so catching even a portion of failures one window early is high-leverage. The score doesn't create these savings by itself — it creates them by making sure the highest-risk asset gets worked before it fails, which is exactly the decision that separates planned cost from emergency cost.
See your fleet ranked by risk — not by whoever radioed in last
HVI turns the inspection, PM, defect and repair records your team already creates into a transparent, drillable equipment health score for every asset — ranked, banded, and openable so your planner sees exactly what's dragging each machine down. No new sensors required to start. Live on your asset register in under two weeks.
No credit card · Built on your existing records · Works with OEM telematics