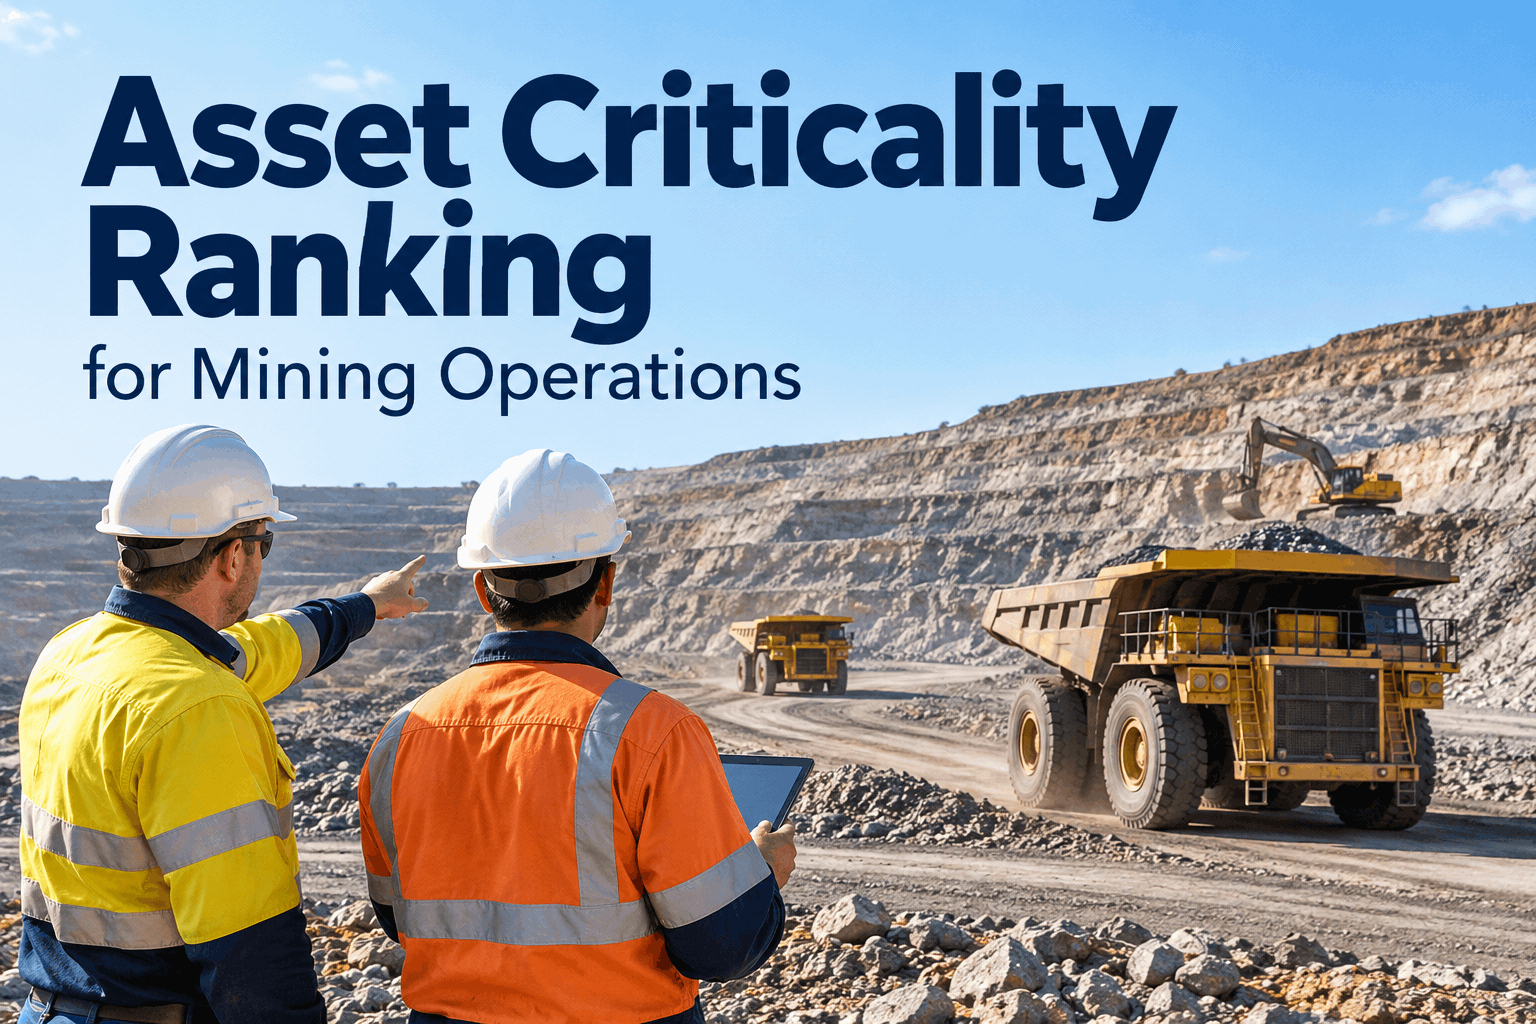
Ask ten people on a mine site which asset matters most and you'll get ten answers — usually whatever broke last. Asset criticality ranking replaces that with a defensible order: score every machine by what happens if it fails, and let that score, not the loudest breakdown, decide where maintenance effort goes first. A crusher that stops the whole plant outranks a light vehicle, and criticality ranking proves it on paper. This guide builds the method for mining fleet and fixed plant. Book an asset-criticality demo to see it applied.
Not every asset deserves the same attention
Maintenance budget is finite. Asset criticality ranking scores each machine by its failure consequence, sorts the fleet into tiers, and points your effort where a failure hurts most — by evidence, not by whoever shouts loudest.
-
A
Primary crusherStops the plant92
-
B
Haul truck HT-114One of a fleet61
-
C
Light vehicle LV-08Easily substituted24
Criticality ranking answers one question for every asset on site: if this fails, how much does it cost us — in safety, in production, in money? Score that consistently and your whole fleet sorts into a defensible order you can take to a budget meeting. Below is the scoring model, the matrix that turns scores into tiers, what each tier earns in maintenance, and how to build the ranking from real data.
The scorethe weighted factors that make up a criticality ranking
Criticality isn't one number — it's a weighted blend of how badly a failure hurts and how likely it is. Score each factor, weight them to your operation, and combine.
Can its failure injure someone or breach environmental limits? This factor usually carries the heaviest weight.
Does it stop the whole line, slow it, or just dent output? A single-point-of-failure asset scores high.
What does it cost to fix or replace, and how long is the lead time on spares?
How often does it actually fail? Scored from real maintenance history, not reputation.
Consequence factors (safety, production, cost) answer "how bad"; likelihood answers "how often". Multiply or weight-sum them and you get a single criticality score per asset — comparable across a crusher and a light vehicle. See failure-history reporting that supplies a real likelihood score, or book a demo of criticality scoring.
The matrixplotting consequence against likelihood to assign a tier
The classic criticality matrix plots consequence up the side and likelihood across the bottom. Where an asset lands decides its tier — and its whole maintenance strategy.
A high-consequence asset lands in tier A even at low likelihood — a crusher that rarely fails but stops the plant still demands the most attention. That's the whole point: criticality follows the stakes, not just the failure rate. See how HVI covers mining mobile and fixed assets in one register.
Tier to strategywhat each criticality band actually earns in maintenance
A ranking that doesn't change what you do is just a spreadsheet. Each tier maps to a defined maintenance strategy — that's where criticality pays off.
- Condition monitoring & predictive tasks
- Tight, frequent PM intervals
- Critical spares held on site
- FMEA run on its key failure modes
- Scheduled preventive maintenance
- Regular inspection coverage
- Spares planned, not all stocked
- Monitored for climbing failure trends
- Run-to-failure or basic PM
- Routine inspection only
- Spares sourced as needed
- Minimal monitoring overhead
This is how a finite budget gets spent well: the A-tier crusher earns condition monitoring and on-site spares, the C-tier light vehicle runs to failure, and nothing in between is over- or under-maintained. See PM scheduling that sets interval intensity by tier, or book a demo of tier-based maintenance.
A worked examplecriticality across a mixed mining operation
Here's how a handful of real mining assets sort out once you score consequence and likelihood together.
Single point of failure for the whole processing line. High consequence regardless of how rarely it fails.
Its stoppage halts throughput downstream. No redundancy means maximum production consequence.
Important, but one of many identical units. A single truck down dents production, it doesn't stop it.
Feeds the haul cycle; losing one slows a dig face. Essential, with partial backup from other loading units.
Easily substituted, low cost, no production role. Run-to-failure is the rational strategy.
Redundant and non-production. Basic PM is enough; no need for premium maintenance spend.
Notice the crusher and conveyor top the list on consequence alone, while the haul truck — which fails more often — sits a tier below because the fleet absorbs its loss. That's criticality thinking in action. See bad-actor ranking for the complementary view of which assets fail most.
Building itthe asset criticality assessment, step by step
You can stand up a working criticality register in five steps — and refine it as real failure data accumulates.
- 1List the assetsEvery machine in scope, mobile and fixed plant
- 2Agree the factors & weightsSafety, production, cost, likelihood — weighted to your site
- 3Score each assetConsistent scales, real history for likelihood
- 4Assign tiersPlot on the matrix, sort into A / B / C
- 5Set the strategy & reviewMap tiers to PM, re-score as data grows
Step 5 keeps it alive: as failures accumulate and the operation changes, likelihood scores shift and assets move tiers. A register that never updates slowly stops matching reality. Sign up free and start your asset register, or book a demo of a living criticality register.
On the recordwhat a tiered asset looks like in the system
- Safety9
- Production impact10
- Replacement cost8
- Failure likelihood4
High consequence, modest likelihood — but the score still puts it in tier A and auto-assigns the premium maintenance strategy. The register turns a ranking into action without a second meeting. See work-order prioritization driven by asset tier.
From the asset desk
Our PM spend was spread evenly across the fleet, which felt fair but was quietly wrong — we were pouring the same effort into light vehicles as into the crushing circuit. A proper criticality ranking changed the conversation: once the register showed the primary crusher at tier A and half our utes at tier C, nobody argued about moving monitoring budget to where a failure actually stops production. It turned maintenance priorities from opinion into evidence.
Asset criticality ranking FAQs
What is asset criticality ranking?
It's scoring every asset by the consequence and likelihood of its failure, then sorting the fleet into tiers so maintenance effort follows risk. A machine whose failure stops production or risks safety ranks highest — regardless of how often it fails — and earns the most maintenance attention.
How is a criticality score calculated?
You score weighted factors — safety and environment, production impact, replacement cost, and failure likelihood — on consistent scales, then combine them into one number per asset. Consequence factors answer "how bad," likelihood answers "how often," and the weighting reflects your operation's priorities.
How is criticality ranking different from FMEA?
Criticality ranks whole assets by importance — which machines matter most. FMEA works inside a single asset, scoring its individual failure modes. Criticality tells you where to focus; FMEA tells you what to do on the critical ones. They work together: rank first, then FMEA your tier-A assets.
What do the A, B and C tiers mean?
A (critical) assets get condition monitoring, tight PM and on-site spares. B (essential) get scheduled PM and regular inspection. C (non-critical) can run to failure or basic PM. The tiers turn the ranking into a maintenance strategy, so finite budget goes where failure hurts most.
What data do I need to rank assets accurately?
Consequence factors come from operational knowledge, but the likelihood axis needs real failure history — per-asset records, downtime and repair data. Without it, likelihood is reputation rather than evidence, and the ranking won't hold up when budget decisions depend on it.
Put your maintenance effort where failure costs the most
HVI gives your criticality register the data it needs and the place it drives action: per-asset failure history for honest likelihood scores, tier-based PM intensity, inspection frequency by criticality, and work-order priority that follows the ranking. Live in under two weeks.
No credit card · Asset reliability reporting from day one