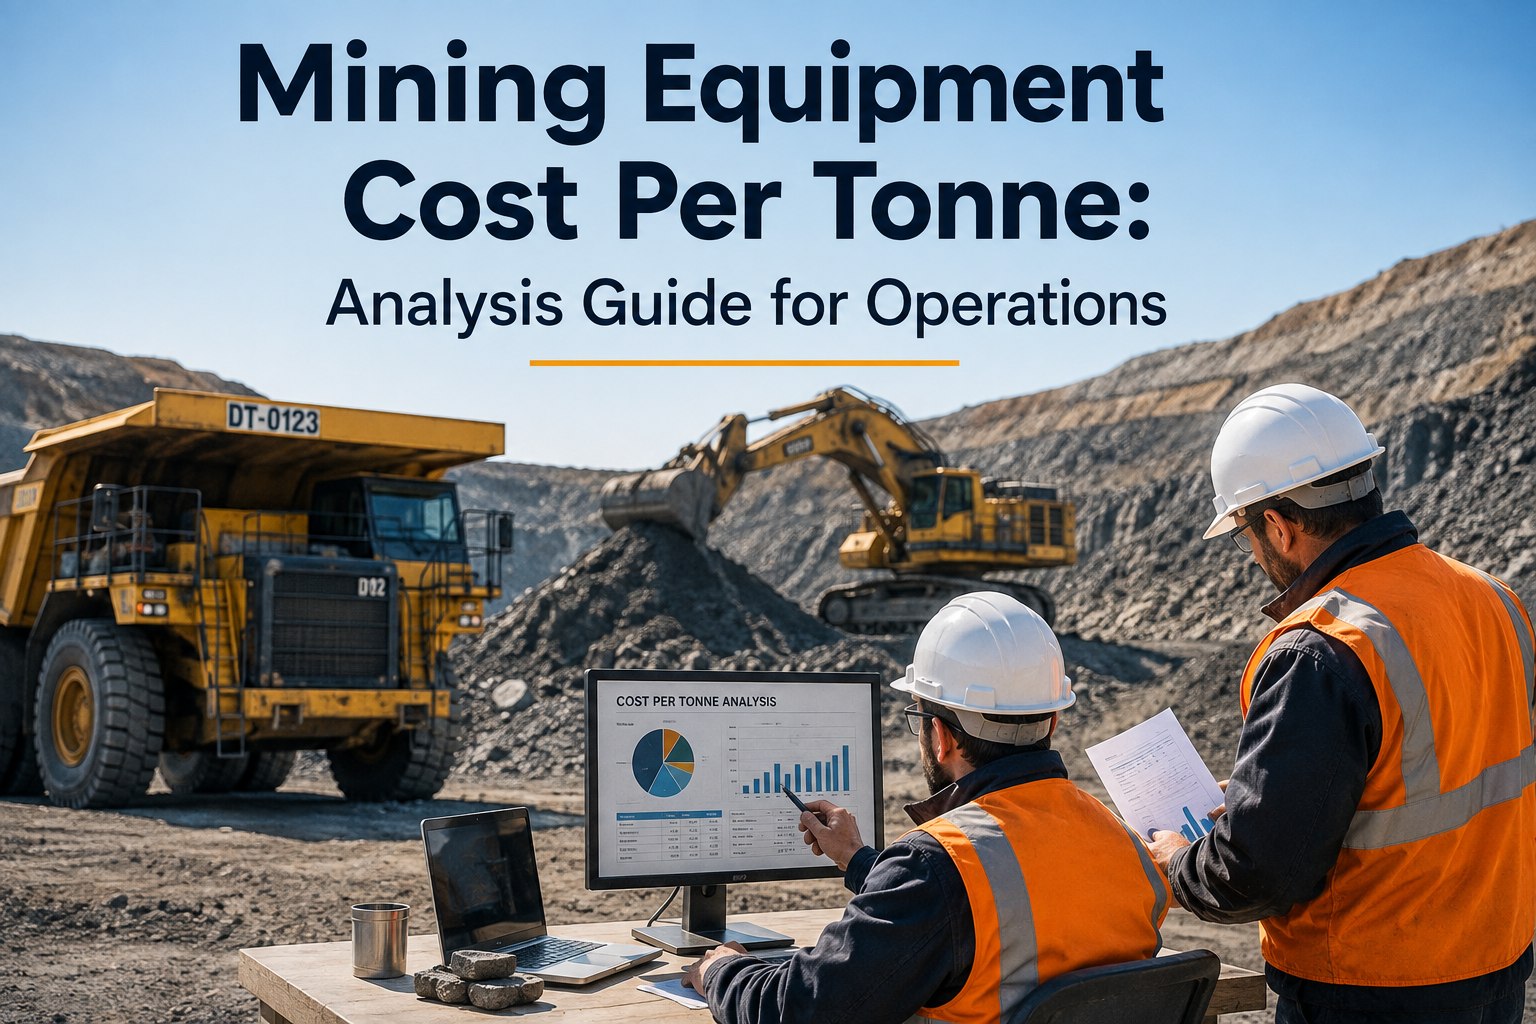
Cost per tonne is how mining operations measure themselves — more than cost per operating hour, more than availability, more than any single equipment metric. But the calculation is not one system's output. It requires cost data from maintenance and inventory systems (ownership, parts, labor, fuel, tires, consumables, GET) and production data from dispatch or production systems (tonnes hauled, tonnes loaded, cycle time). Getting both sides to line up on the same asset, same shift, same period is where most cost-per-tonne programs break down. This 2026 mining equipment cost per tonne guide walks the calculation, the allocation discipline, and where the data lives. Book a demo .
Cost Per Tonne — The Equation That Requires Two Data Sources
Six cost inputs from maintenance and fuel systems. Tonnes from dispatch or production systems. Both sides have to reconcile to the same asset and period.
Cost per tonne is the metric that mine general managers, operations superintendents, and maintenance leaders share — the number that ends up on production reports, in month-end reviews, and in benchmarking against sister operations. When the number moves, everyone wants to know why. But cost per tonne is a composite: cost data from one set of systems, production data from another, allocation rules that decide which asset gets which cost. Getting the calculation right requires discipline on both sides. Getting the analysis useful requires being able to segment it — by asset, by activity, by material, by shift — instead of stopping at the fleet average that hides everything actionable.
The cost stack — where mining equipment spend actually goes6 cost categories, typical share ranges, and where the data lives
Understanding the cost stack matters because it tells you where cost-per-tonne improvements are actually available. A cost-reduction effort focused on operator labor when ownership + fuel + maintenance is 80% of the stack won't move the number. Knowing the stack shape for the specific equipment class is the starting point. Book a demo to see maintenance cost + parts consumption + fuel data organized in HVI
Ownership cost
Typical share: 25–40% for haul trucks; higher for capital-intensive shovels. Components: depreciation, financing cost, insurance, property tax. Data source: finance / ERP; largely fixed once the purchase decision is made. Fixed costs are ~50% of total mining truck costs per industry analysis, making utilization the primary lever for ownership cost per tonne.
Fuel / energy
Typical share: 20–35% for diesel haul trucks; lower for electric equipment (energy still ~10–20% of TCO). Components: diesel, DEF, electricity for electric equipment. Data source: fuel tracking system, bulk fuel deliveries, fuel cards. Fuel-per-tonne is the most direct operational efficiency metric — sensitive to load, route, grade, and idle time.
Maintenance parts + labor
Typical share: highly variable by equipment. Per InfoMine data cited in industry research: 32% of total operating cost for wheel loaders, 50% for backhoe shovels, 59% for hydraulic front shovels, 64% for cable shovels. Data source: CMMS / maintenance system, parts inventory, labor tracking. Includes both scheduled overhauls and unscheduled repairs.
Tires + TKPH management
Typical share: 8–15% for haul trucks; ultra-class truck tires can push higher. Components: tire replacement, repair, TKPH-driven early replacement. Data source: tire management system or CMMS. TKPH (tonne-kilometer per hour) rating is the key spec — operating above rated TKPH accelerates tire heat degradation.
Ground engaging tools (GET)
Typical share: 3–10% for loading equipment (shovels, loaders); minimal for haul trucks. Components: teeth, adapters, cutting edges, bucket wear packages. Data source: parts consumption in CMMS or inventory. Wear rates are heavily material-dependent — abrasive ore doubles GET consumption vs less abrasive material.
Operator labor + consumables
Typical share: 10–20% depending on labor market and operational model. Components: operator wages + burden, supervisor allocation, lube, DEF, small consumables. Data source: HR / payroll for labor; CMMS or inventory for consumables. Semi-fixed — scales with shifts operated, less with tonnes moved.
Allocation discipline — assigning cost to the correct asset and activityThe bookkeeping that turns raw cost data into unit-cost analysis
Cost data is useful only when it's assigned to the right asset and the right activity. A parts purchase for haul truck #217 has to be tagged to that specific unit, not to a general fleet account. A shovel operator's shift has to be allocated to loading time, not swept into general operations. Allocation discipline is where cost-per-tonne programs earn their credibility — and where they most often break.
Per-asset cost centers
Activity split (load / haul / idle)
Overhaul amortization
Shared-cost allocation rules
Decisions that unit-cost analysis actually supportsWhere cost per tonne changes the answer vs where it just confirms it
Cost per tonne earns its analytical weight only when it changes decisions. Most operations already know their high-cost equipment; unit-cost analysis becomes valuable when it segments the cost signal in ways that reveal what to do about it. Start a free trial to see per-asset maintenance and parts cost trends in HVI.
Fleet utilization
When fixed costs are ~50% of total truck costs, ownership cost per tonne is dominated by utilization. A truck operating 5,000 hrs/yr has half the ownership cost per tonne of the same truck operating 2,500 hrs/yr. Unit-cost analysis identifies underutilized units for redeployment, shift consolidation, or fleet rightsizing.
Operating practices
Idle-time cost per tonne, overload penalty via TKPH-driven tire replacement, fuel consumption vs Caterpillar 10/10/20 payload compliance. Unit-cost analysis surfaces operator-behavior cost differences that fleet averages hide — and identifies training targets that produce measurable cost signal.
Maintenance strategy
Cost per tonne trend by asset shows when scheduled PM is producing measurable cost avoidance vs when it's just spending money. Unit-cost trending catches drift between similar assets — two haul trucks of the same model running $0.03/t apart typically means a maintenance issue, not a random variance.
Rebuild vs replace timing
The cost curve on aging equipment eventually turns up — when cost per tonne on unit #217 exceeds the cost per tonne on a new equivalent, rebuild economics have to be evaluated against replacement. Unit-cost trending over 24+ months gives the signal to run this analysis before the cost curve becomes obvious.
Route and material planning
Cost per tonne segmented by material and destination catches hauls that are structurally more expensive — longer route, worse road, more abrasive material. Informs pit-plan sequencing, waste dump destination choices, and short-term operational decisions with actual cost signal instead of assumed cost signal.
Benchmarking + capital planning
Cost per tonne against sister operations or industry benchmarks is what feeds board-level capital allocation. But benchmarking is only useful if the calculation methodology is consistent — comparing your cost per tonne including overhaul amortization to a benchmark that excludes it produces false signals.
From a mine operations superintendent on unit-cost analysis in practice
We had fleet-average cost per tonne on our dashboard for years. It moved in a narrow band; nobody could ever act on it. What changed our operations was segmenting the number — per truck, per shift, per material, per haul destination. Same total spend, same total tonnes, but now we could see that trucks 8 and 12 were $0.06/t above the fleet average consistently, both on the same haul route out of pit 3. Turned out to be two operators on shift B who were running underloaded because they didn't trust the load-out weight indicator.
Fleet average had hidden that for years. Per-asset per-shift signal made it obvious. We fixed the load-out issue and both trucks came in line within three weeks. Cost per tonne isn't magic — it's just what happens when you actually connect the maintenance cost data to the production data at a segment level instead of totals level.
Frequently asked questions
How is mining equipment cost per tonne calculated?
Cost per tonne divides total equipment cost for a defined period by tonnes moved during that period. The cost side includes six categories: ownership (depreciation, financing, insurance, property tax), fuel or energy consumption, maintenance parts and labor, tires and TKPH-driven replacement, ground engaging tools (GET) for loading equipment, and operator labor plus consumables. Typical share ranges vary substantially by equipment class — per industry research, maintenance alone can represent 32% of total operating cost for wheel loaders and up to 64% for cable shovels. Fuel typically runs 20–35% for diesel haul trucks. Fixed costs (ownership) can be roughly 50% of total mining truck costs, making utilization the primary lever for ownership cost per tonne. The production side comes from dispatch, fleet management, or production systems: tonnes hauled or loaded, cycle count multiplied by payload, reconciled to the same shift, day, or month as the cost data. The calculation itself is straightforward; the discipline is in the allocation of cost to the correct asset and activity so the segment-level analysis produces reliable signals rather than misleading averages.
What data allocation discipline does cost-per-tonne analysis require?
Four allocation disciplines matter. First, per-asset cost centers: every parts purchase, work order, and consumable draw tagged to a specific asset (haul truck 217, shovel 3) rather than a fleet-level account, enabling per-asset cost accumulation. Second, activity split: operating hours and fuel consumption split by activity (loading, hauling, positioning, idle) so cost per productive hour can be distinguished from cost per operating hour. Third, overhaul amortization: major overhauls of $200K to $1M+ smoothed across expected remaining life rather than landing in a single month's cost that would distort unit-cost analysis. Fourth, shared-cost allocation rules: shop overhead, supervisor labor, and general consumables assigned to individual assets via documented, consistent rules (per operating hour, per available hour, per tonne moved) rather than ad-hoc month-to-month reallocation. Sloppy allocations produce confident numbers that mislead decisions — the bookkeeping discipline at the transaction level determines whether the resulting analysis is trustworthy or noise.
What decisions does unit-cost analysis actually support?
Six decision categories where cost per tonne changes the answer rather than just confirming it. Fleet utilization: because ownership is largely fixed and roughly 50% of total truck cost, underutilized units carry substantially higher cost per tonne on the same equipment — identifies redeployment, shift consolidation, or fleet rightsizing candidates. Operating practices: unit-cost segmentation surfaces operator-behavior cost differences (idle time, payload variance, fuel-per-tonne) that fleet averages hide. Maintenance strategy: cost per tonne trend by asset shows when PM is producing measurable cost avoidance and catches drift between similar assets. Rebuild versus replace timing: unit-cost trending over 24+ months signals when to evaluate rebuild economics against replacement. Route and material planning: cost-per-tonne segmentation by material and destination identifies structurally expensive hauls. Benchmarking and capital planning: unit cost against sister operations or industry benchmarks feeds board-level capital allocation, valid only when methodology is consistent between the compared operations.
Does HVI support mining cost-per-tonne analysis workflows?
Partially — HVI supports the cost-side data needed for the calculation, not the calculation itself or the production-side data. On the cost side, HVI supports maintenance cost tracking per asset (work orders with parts, labor, and time), parts consumption tagged to work orders and assets, inventory transactions with cost data, fuel consumption tracking per unit, and searchable cost history per asset for month-end review or long-term trend analysis. Production data (tonnes hauled, tonnes loaded, cycle time, payload records) comes from dispatch systems, fleet management systems, or production reporting systems — not from HVI. The cost-per-tonne calculation itself happens when both data sets meet, typically in a BI tool, exported spreadsheet analysis, or an integration between HVI and the production system. HVI is not a mining dispatch system, a fleet management system with production tracking, an ERP financial system, or a mining cost management platform. What HVI provides is the maintenance, parts, inventory, and fuel data at per-asset granularity that becomes the numerator of the cost-per-tonne equation.
Why is cost per tonne more useful than cost per operating hour?
Cost per operating hour tells you what an asset spent during operation. Cost per tonne tells you what the operation earned per dollar spent. They can move in opposite directions and both be accurate. A haul truck operating at $85 per hour hauling 3,000 tonnes per shift produces $0.23 per tonne unit cost; the same truck at $85 per hour hauling 1,800 tonnes per shift produces $0.38 per tonne — 65% higher unit cost on the same equipment with identical spend. The cost per operating hour hides the productivity difference entirely. Cost per tonne exposes it. For decisions like fleet utilization, operator practices, route planning, and capital allocation, unit cost is the metric that actually changes the answer. Cost per operating hour remains useful for maintenance budgeting and internal benchmarking within a class of equipment, but it's insufficient on its own for operational or capital decisions. The two metrics complement each other — unit cost provides the operational lens, hourly cost provides the maintenance-management lens.
Feed the cost side of cost per tonne with per-asset data organized for analysis
HVI supports maintenance cost tracking per asset, parts consumption per work order, inventory transactions, fuel consumption per unit, and searchable cost history for month-end and trend analysis — the cost-side data feeding equipment cost per tonne calculation. Production data and the cost-per-tonne calculation itself remain with dispatch, fleet management, and BI systems. HVI is the maintenance and consumption data layer at per-asset granularity.
No credit card · No hardware · Per-asset cost templates ready on day one