You know the feeling. The quarter closes, the fleet-wide maintenance number looks acceptable, and then unit 214 rolls in with its third turbo in eighteen months and you realize the average has been lying to you all year. Cost per mile trucking math only works when it is calculated per unit, per truck, per trailer - because the fleet average hides the two or three vehicles that are quietly burning your margin. This page breaks down what to capture per unit, how to split tractor and trailer costs, why roadside repairs cost multiples of shop work, and how per-unit cost per mile turns a maintenance budget into a replacement decision. If you want to see this running on your own units before the next quarter closes, book a 30-minute walkthrough and we will show you the per-unit view on real data.
The Fleet Average Is Hiding Your Worst Truck
Most carriers track maintenance cost per mile at fleet level. The trucks destroying that average stay invisible until a catastrophic failure forces the conversation. Per-unit tracking surfaces them months earlier - while you still have a trade decision to make, not a wreck to recover.
The Real Cost of Not Tracking Cost Per Mile Per Unit
These are not abstract benchmarks. Each one is a number that shows up in your shop, your fuel bill, or your replacement cycle - and each one gets worse when you only look at the fleet average.
The Six Cost Categories That Belong on Every Unit's Ledger
Fleet-wide totals blur these together. Per-unit tracking keeps them separate so you can see which category is driving the cost on which truck - and act before it compounds.
Parts
Every filter, brake chamber, sensor, and turbo logged against the unit it went into. Not the shop total - the unit total. When unit 214 shows $4,800 in parts over six months and the fleet median is $1,900, you have a conversation to have.
Shop Labour
Hours per work order, per unit. A truck that needs 14 labour hours a month while its siblings need 6 is telling you something the parts total alone will not. Labour is where repeat failures and comebacks show up first.
Outside Vendor Repair
Dealer invoices, independent shop bills, and mobile mechanic calls - all logged to the unit, not dumped into a general ledger line. Vendor work is where per-unit costs spike hardest and where warranty recovery opportunities hide.
Tyres
Steer, drive, and trailer positions tracked separately per unit. A tractor eating steer tyres at 40,000 miles while the fleet average is 90,000 has an alignment or suspension problem - or a driver habit - that the tyre bill alone will flag.
Fuel
Miles per gallon per unit, per route, per driver. A 0.5 MPG drop on one tractor across 100,000 miles is roughly $3,000-4,000 in extra fuel at current prices - and it usually signals a mechanical issue before the driver reports one.
Downtime
Revenue miles lost while the unit sits. A truck down for three days on a lane that pays $2.80 per mile just cost you 1,500-2,000 miles of revenue - and that number belongs on the unit's ledger, not in a separate downtime report nobody cross-references.
How Per-Unit Cost Per Mile Identifies the Trade Candidate
A rising cost per mile on a specific tractor is the earliest replacement signal you will get - months before a catastrophic failure forces the decision at the worst possible time.
Baseline every unit
Log every work order, every part, every labour hour, every vendor invoice against the unit. Most carriers discover their per-unit data is incomplete within the first month - the gaps themselves are diagnostic.
Watch the trend, not the snapshot
One bad month is noise. Three consecutive months above fleet median is a pattern. The units that trend upward are the ones that fail catastrophically - the trend gives you 4-6 months of lead time the failure does not.
Compare against replacement cost
When a unit's maintenance CPM approaches the depreciation-plus-finance cost of a new unit, the trade decision is already made - you are just choosing whether to make it on your schedule or the truck's.
Make the trade before the failure
A planned trade at 450,000 miles with full service history commands a better price than a distressed sale after a blown engine at 470,000. Per-unit CPM is the number that lets you choose the timing.
Why Your Trailer Cost Per Mile Is Probably Wrong
Trailers represent 20-30% of fleet maintenance spend on most mixed operations - and most carriers track them in a single lump line, if at all. The result: trailer costs get absorbed into the fleet average and individual problem trailers stay invisible for years.
What tractor tracking catches
- Engine and drivetrain trend by unit and mileage band
- Aftertreatment and DEF system cost per unit
- Steer tyre wear patterns flagging alignment issues
- Labour hours per unit revealing repeat-failure trucks
What trailer tracking catches
- Brake and wheel-end cost per trailer position
- Floor, roof, and door repair frequency by unit
- Tyre cost per trailer - often higher per mile than tractor
- Which trailers are dragging down utilization and why
The trailer blind spot is expensive. A 40-truck carrier running 60 trailers with no per-trailer tracking will typically find 4-6 trailers consuming double the fleet median in brake and tyre work - and those trailers have been in the fleet for years without anyone flagging them. If you want to see per-trailer cost tracking on your own fleet, we can walk through it with your actual unit list.
See Which Units Are Above Your Fleet Median - Before the Next Quarter Closes
HVI captures parts, labour, vendor, tyre, fuel, and downtime per unit automatically. Book a demo and we will show you the per-unit cost view on your own fleet data.
The Two Cost Recovery Opportunities Most Carriers Miss
Per-unit history does not just identify problem trucks - it recovers money you are already owed and prevents the most expensive repairs you will ever pay for.
Warranty Recovery
OEM warranties cover parts and labour on defects within the coverage window - but only if you can prove the failure, the mileage, and the service history. Per-unit records with timestamps, photos, and work order linkage turn a denied claim into a paid one. Most carriers recover 8-12% of parts and labour spend when they track per unit; most carriers who do not track recover close to zero.
A 40-truck carrier spending $18,000/month on parts and labour, recovering 10% through warranty claims, puts $1,800 back every month - $21,600 a year - from records they already have but cannot currently produce.
Roadside Repair Premium
An over-the-road breakdown costs multiples of the same repair done in your shop. Towing alone runs $300-800 for a heavy unit. The repair itself at roadside rates is typically 2-4x shop cost. Add driver wait time, missed delivery windows, and potential cargo claims, and a single roadside event can cost $1,200-2,500 before the truck moves again. Per-unit PM tracking catches the failures before they become roadside events.
A carrier averaging six roadside breakdowns a month at $1,500 each spends $9,000 monthly on preventable failures. Cutting that to two through per-unit PM compliance saves $6,000 a month - $72,000 a year - in repair premium alone.
How Maintenance Cost Per Mile Moves Your Operating Ratio
Operating ratio - total operating cost divided by revenue - is the number your lender, your insurer, and your board watch. Maintenance is one of the few line items you can actually move, and per-unit tracking is how you move it.
| Scenario | Fleet Maintenance CPM | Impact on 100-Truck Fleet | Operating Ratio Effect |
|---|---|---|---|
| Fleet average only, no per-unit tracking | $0.18/mile | Baseline - problem units hidden in the average | Baseline |
| Per-unit tracking, 3 worst units identified and traded | $0.16/mile | $200,000/year saved on 10M fleet miles | -0.4 to -0.6 points |
| Per-unit + warranty recovery + roadside prevention | $0.14/mile | $400,000/year saved on 10M fleet miles | -0.8 to -1.2 points |
The math is not subtle. On a fleet running 10 million miles a year, every $0.01 per mile you shave off maintenance cost is $100,000 back to the bottom line. Per-unit tracking is the only reliable way to find those cents - the fleet average will never show you where they are hiding. If you want to run this analysis on your own units, we can show you the per-unit view in a 30-minute demo.
Per-Unit Cost Tracking, Built Into Every Work Order
HVI captures the six cost categories automatically as your team works - no separate spreadsheet, no end-of-month reconciliation, no guessing which unit the invoice belongs to.
Expense Track and Cost Analysis
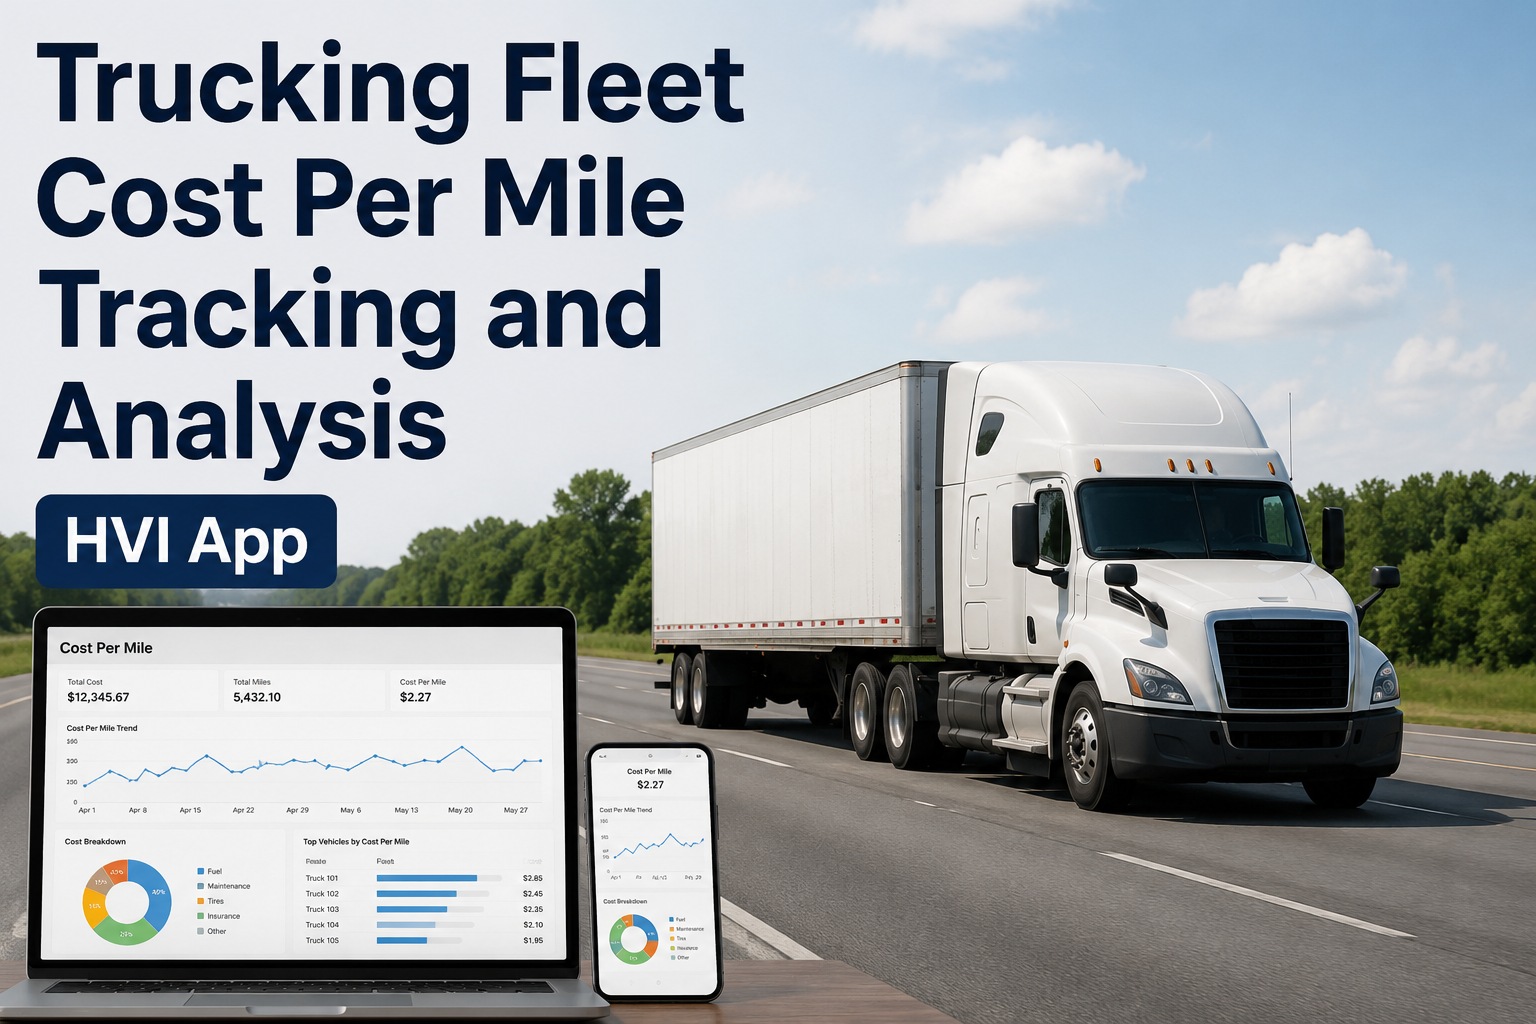
Every part, every labour hour, every vendor invoice logged against the unit it belongs to. Cost per mile per unit calculated automatically - tractor and trailer separated, trend lines visible, outliers flagged.
Labour and Material Per Work Order
Technicians log hours and parts directly on the work order from any phone or tablet. No paper tickets to reconcile, no shop totals to allocate after the fact. The unit ledger builds itself as the work happens.
Fuel Logs and Storage
Fuel entries per unit with automatic MPG calculation. A drop in fuel economy on one tractor flags a mechanical issue before the driver notices - and before it becomes a roadside event at 3-5x shop cost.
Analytics and Reporting
Cost per unit, cost per mile, uptime, and trend reporting across the fleet. The replacement candidate report shows you which units are trending above median - months before the failure makes the decision for you.
What Per-Unit Cost Per Mile Actually Buys You
If you are ready to start tracking cost per mile per unit instead of reconciling fleet averages at month-end, HVI is free to start and works on any phone your team already carries.
I used to find out a truck was a problem when the engine let go. Now I watch the cost per mile trend on every unit, and when one crosses twenty-two cents for three months straight, it goes on the trade list. We have not had a catastrophic failure force a replacement in two years. The number tells you before the truck does.
Cost Per Mile Tracking - What Fleet Managers Ask
What is a good maintenance cost per mile for a trucking fleet?
How do I track cost per mile per truck without adding admin work?
Should I track tractor and trailer cost per mile separately?
How does per-unit cost tracking help with warranty recovery?
When should I replace a truck based on cost per mile?
Stop Letting the Fleet Average Hide Your Worst Trucks
HVI tracks cost per mile per unit automatically - parts, labour, vendor, tyres, fuel, and downtime - so you see the trade candidates months before they fail. Book a demo and we will show you the per-unit view on your own fleet.
Free to start - Works on any phone - No card needed