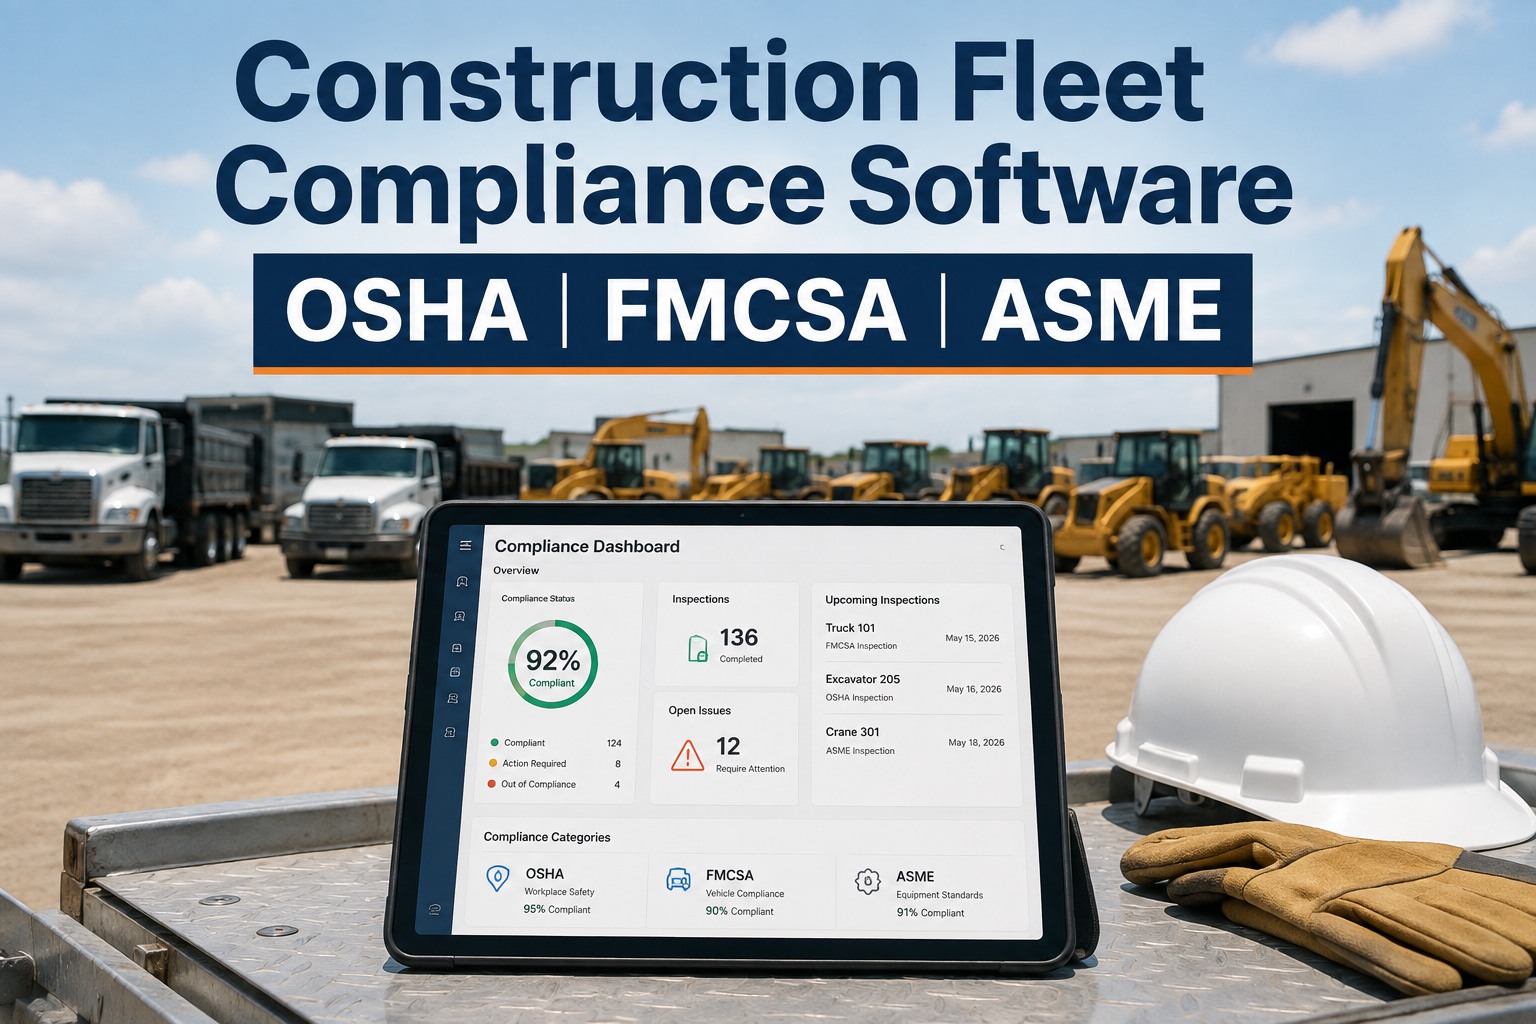
Most construction fleet dashboards show twenty widgets and answer zero real questions. The construction equipment KPIs that actually matter fit on one screen: is PM current, are inspections happening, and how many defects are sitting open right now. Book a demo to see what a dashboard built around those three questions looks like.
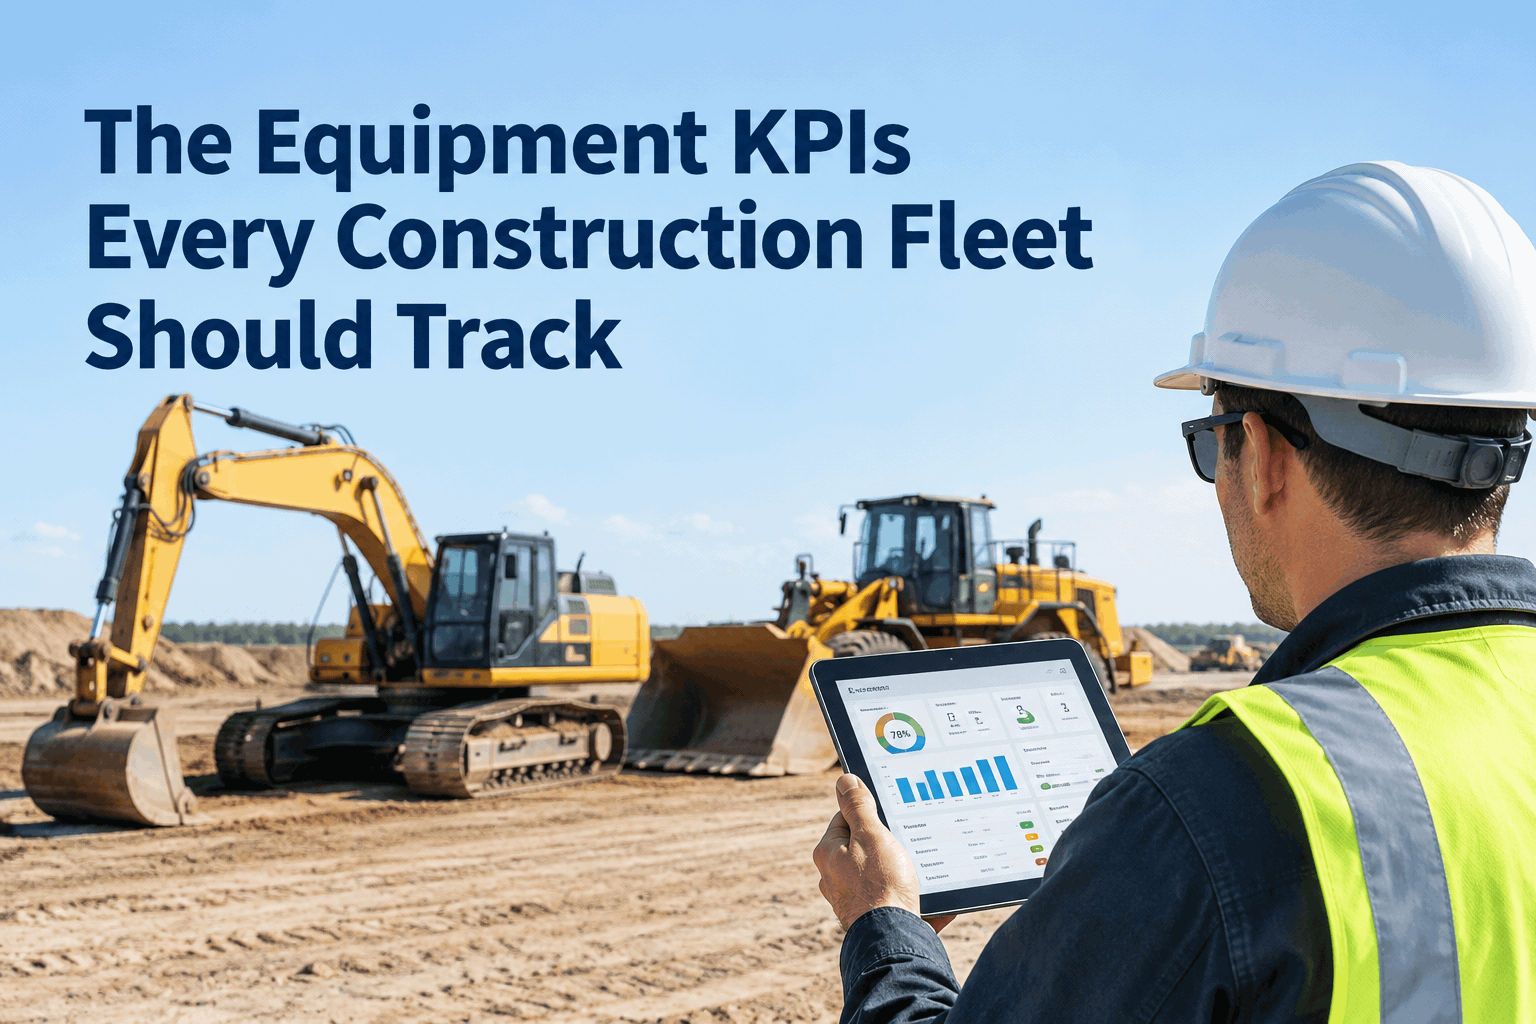
The Equipment KPIs Every Construction Fleet Should Actually Track
Not twenty metrics competing for attention — five that tell you whether your fleet is ahead of problems or behind them, by machine, by site, today.
A truck-fleet dashboard built around cost-per-mile and DOT compliance doesn't translate cleanly to an excavator or a roller — there's no mileage, no DVIR, and "compliance" means something different when the question is whether the undercarriage was inspected this week, not whether a driver logged hours.
Five construction equipment KPIs, not twenty-five metricseach one answers a different question
Book a demo to see these calculated live against your fleet, not a sample dashboard.
Is maintenance keeping pace with how hard the machine is working?
Completed PM services on time, divided by PM services due — tracked by engine hours per asset, not a shared calendar date.
Which machines are already past due, right now?
A single number per site or fleet — every excavator, roller, or loader currently running past its scheduled service window.
Are pre-shift walkarounds actually happening?
Completed inspections divided by required inspections — the earliest signal that a checklist is being skipped before it shows up as a defect nobody caught.
What's been flagged but not yet fixed, and for how long?
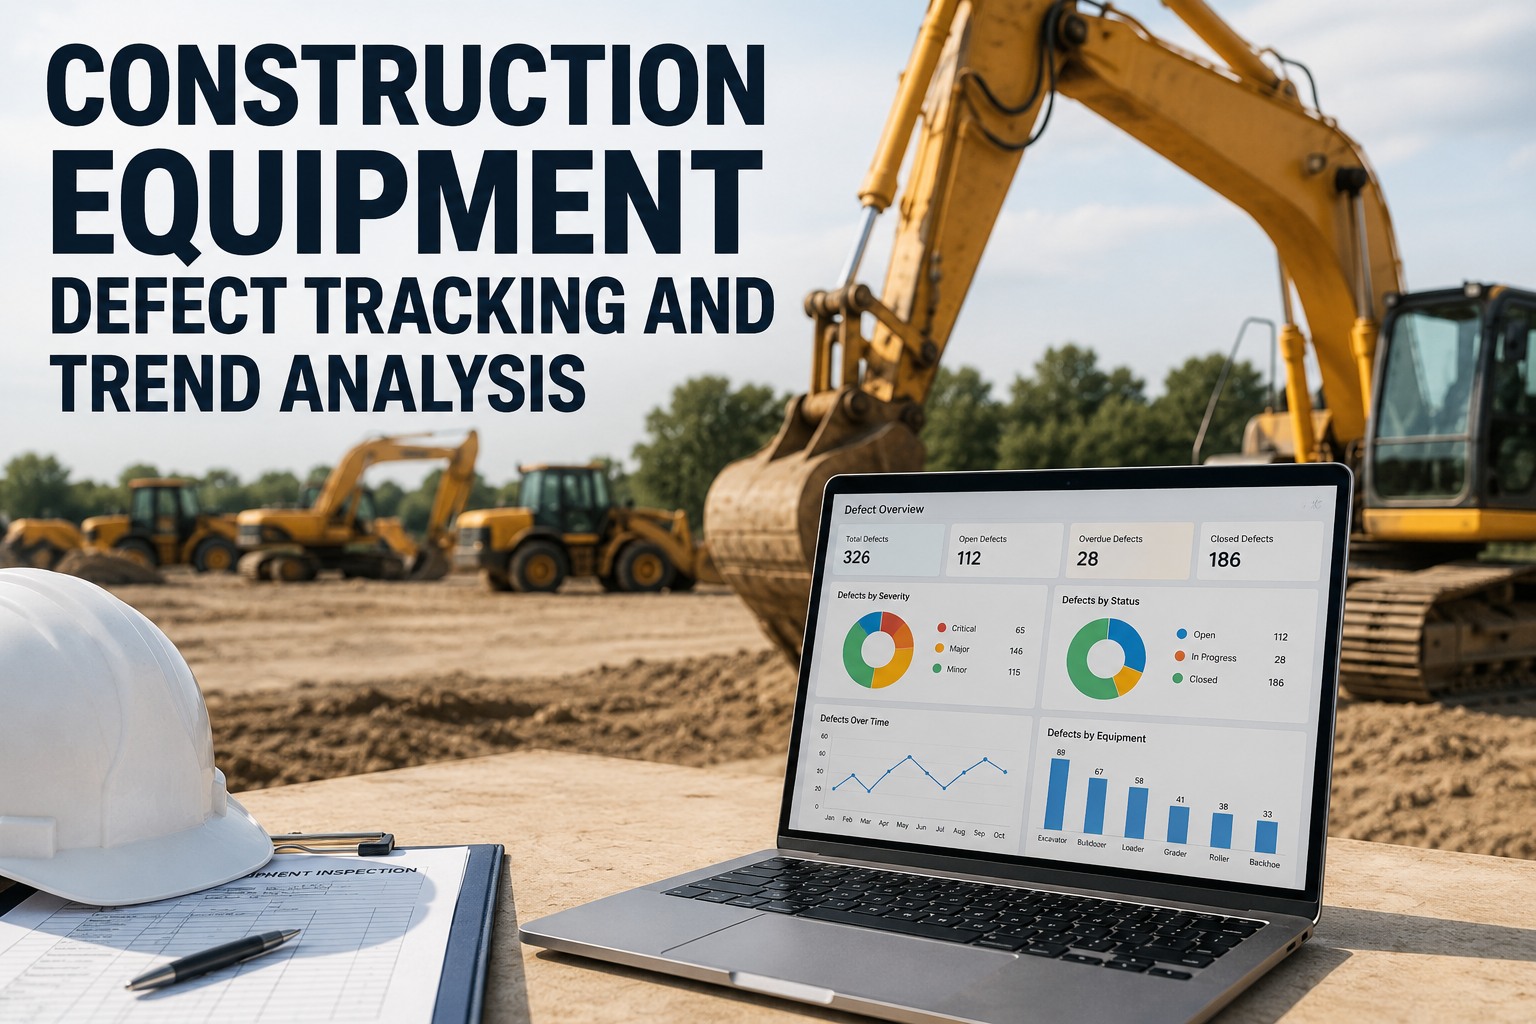
Every outstanding defect, grouped by how long it's been sitting — a weeping hose flagged three weeks ago is a very different risk than one flagged this morning.
How long from "flagged" to "fixed"?
Average time between a defect being logged and the work order closing — the KPI that shows whether your shop is keeping up with what inspections are finding.
What tracking these actually changesa 90-day pattern once KPIs are actually visible
Nobody fixes a PM compliance problem they can't see. Once overdue PM and open defects are a number on a screen instead of a feeling, the trend tends to move the same direction.
Illustrative pattern based on the kind of shift fleets typically see once KPIs move from a spreadsheet nobody opens to a dashboard that's checked daily.
Who actually looks at which KPIthe same dashboard, different questions by role
For a broader fleet-wide KPI framework that covers trucks and mixed asset types alongside construction equipment, see our fleet maintenance KPI guide.
From an operations director running fleets across four sites
Before, "how's the fleet doing" got answered with a shrug and a promise to check. Now it's a number I can pull up before a Monday call — overdue PM count, open defects, done.
The useful part wasn't the dashboard itself, it was that overdue PM stopped being invisible. You can't fix what you can't see, and for a long time we genuinely couldn't see it.
Frequently asked questions
What KPIs matter most for construction equipment, as opposed to a general vehicle fleet?
PM compliance tracked by engine hours, overdue PM count, inspection completion rate, open defect aging, and work order cycle time — metrics built around machine usage, not mileage or driver logs.
What is a good PM compliance rate for construction equipment?
Most well-managed fleets target somewhere in the low-to-mid 90s percent; fleets without a tracked PM program often sit well below that without realizing it.
How is inspection completion rate different from PM compliance?
PM compliance measures scheduled service work; inspection completion measures whether the daily or pre-shift walkaround actually happened. A fleet can be strong on one and weak on the other.
Why track open defect aging instead of just the total defect count?
A defect flagged three weeks ago carries more risk than one flagged this morning, even if the total count looks the same — aging shows which items are actually being neglected.
Can these KPIs be tracked across mixed equipment types on one dashboard?
Yes. HVI calculates PM compliance, inspection rates, and defect status per asset automatically, so excavators, rollers, drill rigs, and loaders all show up on the same fleet-wide view.
Get the five KPIs that actually matter, on one screen
PM compliance, overdue PM, inspection completion, open defects, and work order cycle time — calculated automatically from the inspections your operators already complete. No credit card, no hardware to install.
- PM compliance tracked by engine hours, per asset
- Overdue PM and open defects visible fleet-wide
- Inspection completion rate by site and crew
- Work order cycle time calculated automatically