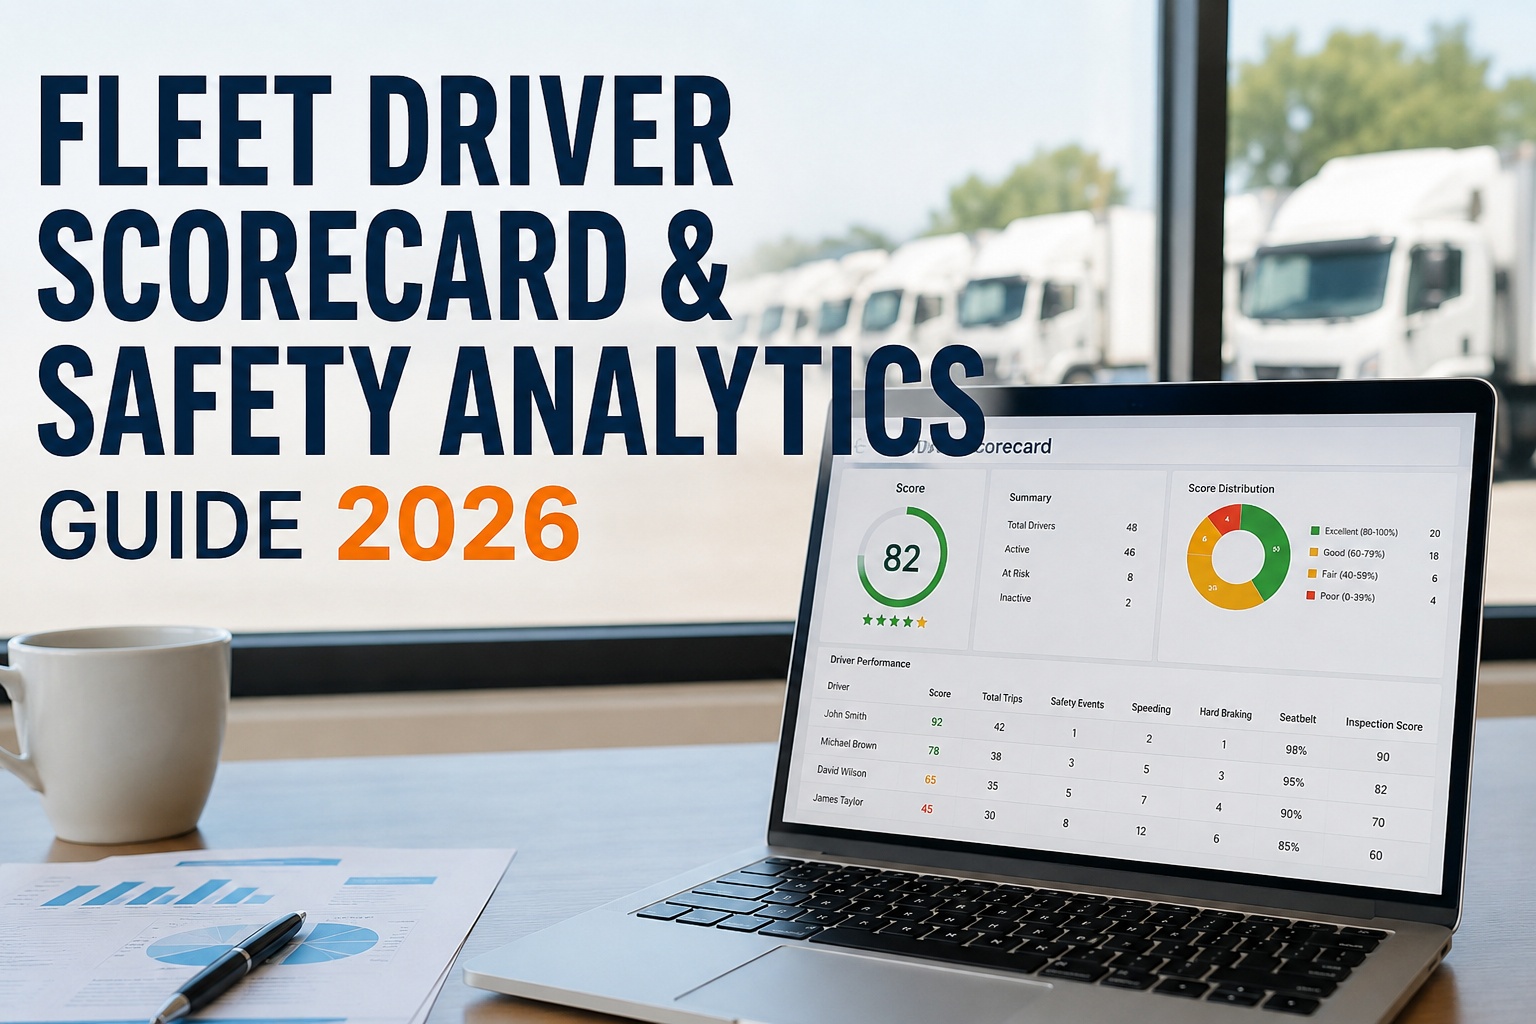
A fleet driver scorecard converts telematics events, inspection findings, and safety incidents into a per-driver risk score — but the scoring model, exposure normalization, and coaching workflow determine whether the number identifies real risk or unfairly penalizes drivers on harder routes. Industry standard uses a 0-100 demerit model with weighted events and per-100-mile normalization; band cutoffs at 90/80/70 map to intervention level. This 2026 guide walks the scoring model, the fairness math, and the coaching workflow that turns scorecards into safer fleets. Book a demo .
Fleet Driver Scorecard — Why Raw Event Counts Lie
Two drivers with the same raw event counts can have completely different risk profiles. Exposure normalization is what separates a fair scorecard from a ranking that fires the wrong drivers.
The most common failure mode in fleet safety scorecards isn't missing data — it's raw event counting without exposure context. A haul-truck operator on 1,800 highway miles per week will always generate more absolute harsh braking events than an urban delivery driver on 350 miles per week, regardless of who's actually driving more dangerously. Rank the two by raw counts and the highway driver takes the intervention while the urban driver, generating events at four times the rate, stays invisible. This isn't a hypothetical failure — it's the pattern that drives driver resistance, produces unfair coaching outcomes, and undermines the credibility of scorecard programs across the industry. The fix is simple in principle and non-negotiable in practice: normalize every event metric against exposure (miles driven, operating hours, or route-time), compare drivers within similar route classes, and let the scorecard identify actual risk rather than punish activity volume.
The scoring model — 0-100 demerit with event severity weightsIndustry-standard scoring model that most telematics platforms and fleet safety programs use
The 0-100 demerit model is the widely-adopted scoring approach because it produces a single intuitive number, supports weighted event severity, and maps cleanly to intervention thresholds. Every driver starts at 100 and loses points as weighted events accumulate; the score resets or rolls on the fleet's defined review period. Book a demo to see HVI's driver performance records and coaching documentation
Rapid acceleration above threshold. Low direct accident correlation on its own but signals aggressive style. Common in urban delivery and stop-start routes.
Deceleration above 0.4g threshold; cornering above lateral-g threshold. Industry data indicates drivers averaging more than 8 harsh braking events per 100 miles show significantly elevated rear-end collision risk within 12 months.
Percentage of driving time above posted limits; following-distance below threshold. Every 1 mph increase over speed limit has been associated with materially higher fatal accident probability per public traffic-safety research.
Direct-cause events with strongest crash correlation. Where camera-based Driver Monitoring Systems (DMS) are lawfully deployed, distraction and fatigue events are weighted at the high end of this range given their accident causation link.
Exposure normalization — the math that makes scorecards fairWhy events-per-100-miles beats raw counts every time and what other normalization dimensions matter
Exposure normalization is what separates a defensible scorecard from a ranking that unfairly penalizes drivers on harder routes. The principle: score the rate at which events occur relative to opportunity, not the absolute count. Once normalized by exposure, high-mileage drivers are compared fairly against low-mileage drivers, and the scorecard identifies actual risk propensity rather than route intensity. Start a free trial to build driver performance tracking into your inspection workflow.
Primary metric: events per 100 miles (US) or 100 km (metric). Baseline the fleet's average rate and score each driver against the fleet baseline, adjusted for route class. Simple, defensible, widely understood.
Events per operating hour where distance is a poor measure — municipal service vehicles, construction fleets, on-site vehicles that accumulate hours faster than miles. Alternative to distance normalization for specific fleet types.
Highway vs urban vs mixed — harsh braking baselines differ 3–5x between route classes. Score drivers within their operational category rather than fleet-wide, or apply route-class weighting to raw event rates.
Advanced normalization accounts for terrain grade, traffic density, and time-of-day patterns. Available in more sophisticated telematics platforms; adds fairness at the cost of model complexity.
Class 8 truck baselines differ from van baselines differ from municipal service vehicle baselines. Score drivers within their vehicle class or apply class-based weighting to prevent apples-to-oranges comparison.
Drivers with insufficient exposure data in the review period (new hires, extended leave, part-time schedules) are excluded from ranking rather than scored on thin data. Prevents statistical artifacts from producing wrong intervention.
Beyond telematics — the inspection + defect signals that complete the pictureWhy driver inspection behavior and recurring defect reporting are underused scorecard inputs
Most driver scorecards weight telematics events heavily and undervalue two signals available in every fleet's inspection records: driver inspection completion patterns and recurring defect reporting. Both correlate with safety outcomes and both are visible without additional hardware.
The signal: Does the driver consistently complete inspections on time, with appropriate detail and photo evidence where required? Drivers who rush or skip inspections have measurably different safety outcomes than those who complete them thoroughly.
Scorecard integration: Track inspection completion rate, average completion time (too-fast is a signal), and photo-evidence quality where required. A pattern of skipped or rushed inspections is a coaching signal even before telematics events surface an issue.
The signal: Which drivers report defects and near-misses proactively, and which reveal defects only after they've caused an incident or been found by shop technicians? Proactive reporting is a leading safety indicator; reactive-only reporting is a lagging one.
Scorecard integration: Weight positive proactive reporting in the driver record. Track drivers who "never find anything" against fleet baseline — a pattern that commonly indicates missed conditions rather than exceptionally clean equipment.
The signal: Are certain defect types recurring on vehicles assigned to specific drivers at higher rates than fleet baseline? Recurring brake wear, tire damage, or body damage concentrated on specific driver histories can indicate operational patterns worth investigating.
Scorecard integration: Cross-reference recurring defect types against driver assignment history. Elevated recurrence on one driver's assignments — controlled for vehicle, route, and mileage — is a scorecard input that telematics events alone miss.
Combining inspection completion patterns, defect reporting behavior, and recurring defect concentration with telematics event data produces a driver safety profile no single data source captures on its own. Book a demo to see HVI's driver-focused inspection and defect records
Coaching workflow — the process that turns scores into outcomesScorecards without coaching produce reports; coaching without documentation produces the same events repeatedly
The scorecard number itself changes nothing. What changes driver behavior is the structured coaching conversation triggered by the score, with specific events reviewed, corrective commitments made, and follow-up documented. Programs that treat scoring as reporting produce no behavior change; programs that treat scoring as the trigger for coaching produce measurable improvement.
Score crosses configured coaching threshold (typically 79 or below) or specific event frequency exceeds limit (typically 5+ high-severity events in review period). Automated alert routes to manager with specific events attached.
Manager reviews specific events, routes, video where available, and driver's recent history. Coaching conversation prepared with concrete evidence rather than abstract "your score dropped" framing.
Structured session covering the specific events, contributing conditions, driver perspective, and concrete corrective commitments. Documented with date, topics covered, driver acknowledgement, and any commitments made.
Score trend reviewed at next review period. Repeated intervention on same driver escalates to structured performance management. Improvement acknowledged and documented; escalation follows fleet HR policy where applicable.
Coaching session documentation is exactly the workflow where digital records systems justify themselves against informal manager notes — searchable multi-year history with per-driver detail is what turns individual conversations into a program. Book a demo to see HVI's coaching session documentation workflow
From a municipal fleet safety manager on scorecard fairness
We launched our first driver scorecard as a raw-event ranking — harsh braking, hard cornering, speeding events, totaled per driver per week. Within a month, drivers on our heavy sanitation routes were furious because they were topping the ranking every week regardless of how carefully they drove. They were right. Our heavy routes had 30 stops per shift; our residential recycling routes had 8. Same drivers on the wrong routes would have topped the ranking.
We pulled the program back, rebuilt it with events per 100 miles as the normalized metric, and split rankings by route class. Six weeks in, the picture flipped: three drivers on the "easier" recycling routes were generating 4-5 events per 100 miles while the sanitation drivers averaged 1.2. The coaching went to the right drivers this time, and the union pushback dropped to essentially zero because the fairness was mathematically defensible. Same telematics data, same drivers, same fleet — different normalization produced completely different intervention decisions. That's the difference between scorecard theater and a safety program.
Frequently asked questions
What is a fleet driver scorecard?
A fleet driver scorecard is a per-driver risk and performance score built from telematics events, inspection data, safety incidents, and other verified operational inputs. The widely-adopted industry approach uses a 0-100 demerit model: each driver starts at 100 and loses points as weighted events accumulate over a rolling review period (typically weekly, monthly, or quarterly). Event weights are commonly graduated by severity: low-severity events like harsh acceleration at 1 point, medium events like harsh braking and cornering at 3-5 points, high events like speeding and tailgating at 10 points, critical events like distraction, seatbelt non-use, and red-light violations at 32-100 points. Score bands map to intervention level: 90-100 excellent (recognize + share), 80-89 good (fleet-wide target), 70-79 coaching (structured session, specific events reviewed), below 70 immediate intervention (ride-along, refresher training, escalation). Effective scorecards normalize event counts against exposure (events per 100 miles or per operating hour) and route class, so drivers are compared fairly rather than ranked by activity volume. The specific weights, thresholds, and score bands each fleet uses should reflect its operating environment, vehicle types, and safety priorities.
Why are raw event counts unfair for driver scorecards?
Raw event counts penalize exposure rather than measuring risk. A driver on high-mileage highway routes will always generate more absolute harsh-braking events than a driver on low-mileage urban routes, regardless of driving quality. Rank by raw counts and the high-exposure driver takes the intervention while the actual risky driver stays invisible. The industry-standard fairness fix is exposure normalization: measure events per 100 miles (or per operating hour where distance is a poor measure), and score each driver against fleet baseline within their route class and vehicle class. Additional normalization dimensions include terrain, traffic density, and time-of-day patterns for more sophisticated models. A driver generating 4 harsh-braking events per 100 miles on an urban route is measurably higher risk than one generating 1 event per 100 miles on a highway route, even if the highway driver's raw weekly count is 3-4x higher. Exposure normalization is the mathematical foundation that makes scorecards defensible in driver coaching conversations, HR reviews, insurance discussions, and any labor or workforce policy context. Programs that skip normalization typically face driver resistance, unfair intervention patterns, and program credibility failure within the first quarter.
What events should a driver scorecard track?
Industry-common scorecards track events across four severity tiers. Low-severity: harsh acceleration events (rapid acceleration above threshold). Medium-severity: harsh braking (deceleration above 0.4g threshold) and harsh cornering (lateral-g above threshold). High-severity: speeding (percentage of driving time above posted limit, and/or magnitude of over-speed events) and tailgating (following-distance below threshold where measurable). Critical-severity: distraction events, seatbelt non-use, and red-light violations. Where camera-based Driver Monitoring Systems (DMS) and Advanced Driver Assistance Systems (ADAS) are lawfully deployed and appropriate for the fleet's operations, additional events include Forward Collision Warning (FCW), Lane Departure Warning (LDW), fatigue detection, and other camera-sourced signals. Inspection and defect data provides additional scorecard inputs commonly underused: pre/post-trip inspection completion rate, inspection completion detail, defect reporting patterns (proactive vs reactive-only reporters), and recurring defect concentration by driver assignment. Coaching completion and training records provide the third data layer. The specific event set each fleet tracks should reflect telematics platform capability, legal and workforce policy constraints on monitoring, and the fleet's specific risk model — not a universal template.
How should a driver coaching program handle low scores?
Effective coaching workflows treat the score as a trigger for a specific process rather than a ranking to be punished. Common structure: the score crossing a configured threshold (typically 79 or below on a 100-point scale) or specific event frequency exceeding a limit (typically 5+ high-severity events in review period) triggers an automated alert to the manager. The manager reviews specific events, routes, and video where available before the coaching conversation, so the discussion is grounded in concrete evidence rather than abstract "your score dropped" framing. The coaching session covers the specific events, contributing conditions, driver perspective, and concrete corrective commitments — documented with date, topics covered, and driver acknowledgement. Score trend at the next review period determines follow-up: sustained improvement is acknowledged and documented; repeated low scores escalate to structured performance management per fleet HR policy. Research and vendor case studies consistently show that transparent scoring criteria, exposure-normalized metrics, and coaching-focused framing produce meaningfully higher driver acceptance than punitive rankings — commonly cited as 80%+ acceptance within 60 days for programs that emphasize coaching over ranking. Documentation of coaching sessions is essential both for behavioral effectiveness and for the record trail supporting insurance, regulatory, and HR contexts.
Where does HVI fit in fleet driver scorecard programs?
HVI operates in the driver performance records, inspection history, defect tracking, and coaching documentation layer of driver safety programs — not as a telematics event capture platform or an automated scoring engine. HVI is not a telematics provider, does not directly ingest telematics events from providers like Samsara, Geotab, or Verizon Connect unless specific integrations are documented, and does not produce automated driver rankings or fixed-formula scores. Features that apply to driver safety records workflows include: per-driver inspection completion tracking (rate, detail, time-to-complete patterns); defect reporting history per driver (proactive vs reactive patterns, recurring defect types by driver assignment); training and certification records per driver with expiration tracking; coaching session documentation with date, topics, and acknowledgement capture; searchable multi-year driver performance history supporting HR, insurance, and safety program response. HVI is not a telematics platform, automated scorecard engine, driver monitoring service, or coaching program provider. Telematics event capture, automated scoring, camera-based monitoring, and specialized driver coaching remain with dedicated telematics platforms, DMS/ADAS vendors, and coaching program specialists. What HVI provides is the driver-focused inspection and defect records infrastructure that complements telematics event data to produce the complete driver safety profile scorecards depend on.
Telematics events tell part of the driver safety story — inspection records, defect patterns, and coaching documentation tell the rest
HVI captures the driver-focused inspection completion, defect reporting patterns, and coaching session documentation that complement telematics event data. Combined, they produce the complete driver safety profile that scorecards, insurance reviews, and safety programs depend on.
No credit card · No hardware · Setup in minutes