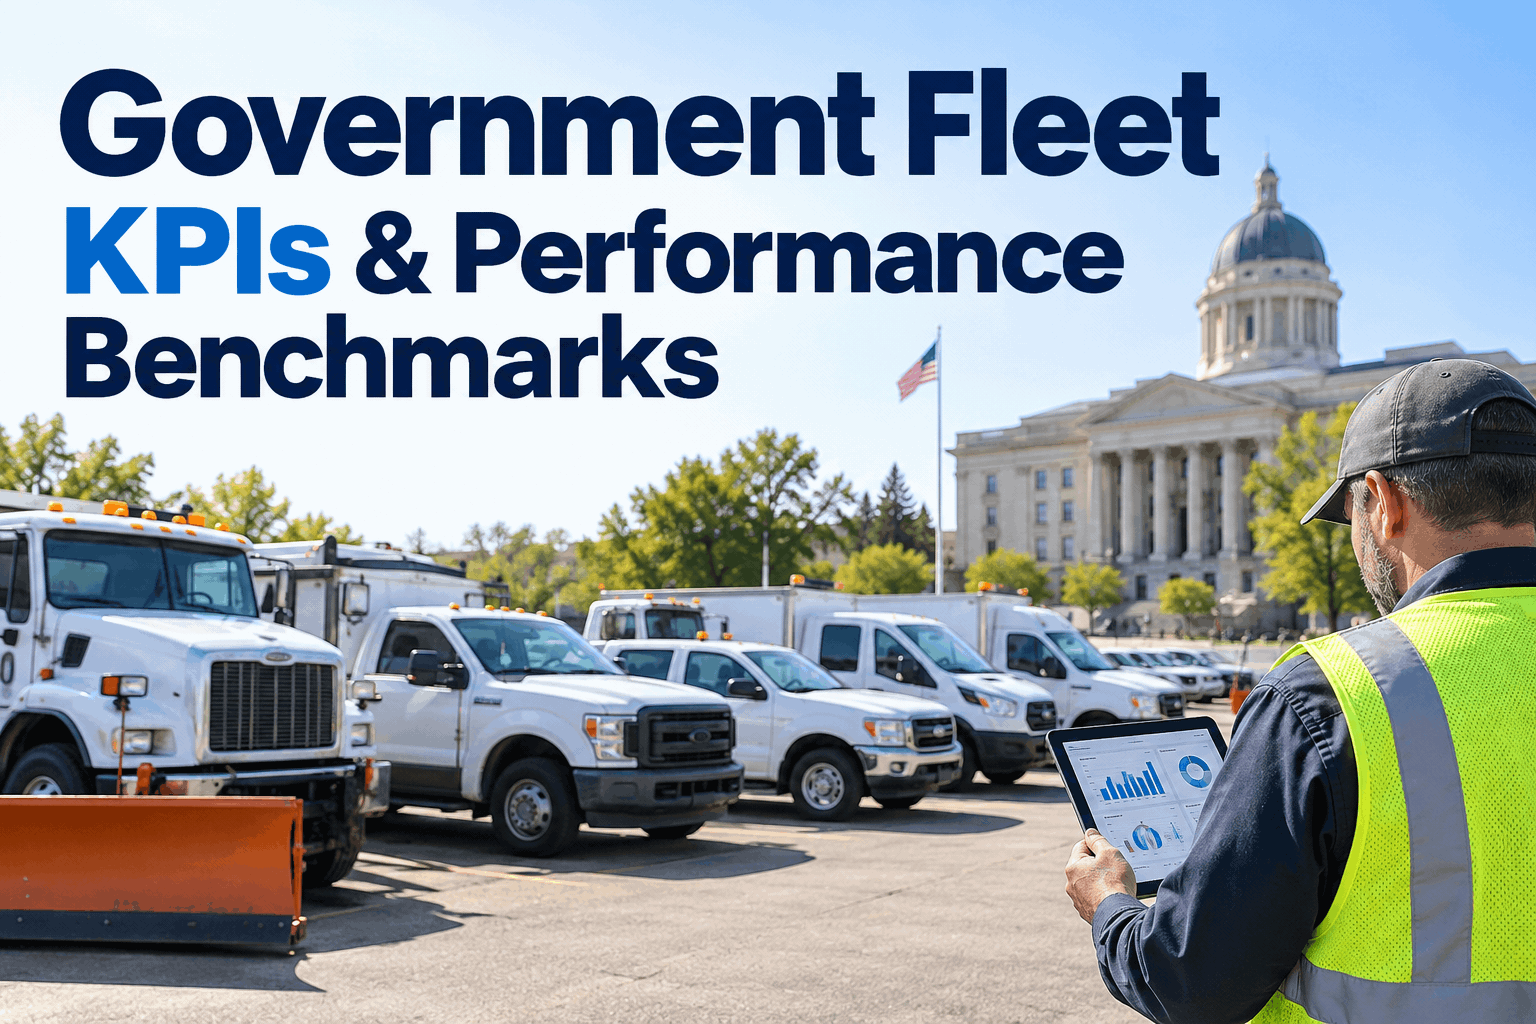
Government fleet KPIs turn thousands of maintenance events, vehicle assignments and operating costs into a few decisions a fleet director can defend. The challenge is not finding more numbers; it is defining measures consistently across police, public works, utilities and other departments. This guide shows how to calculate the core indicators, set useful benchmarks, and build a monthly reporting rhythm with HVI.
Government Fleet KPIs: From Maintenance Data to Better Decisions
Know which vehicles are ready, which costs are climbing and where preventive maintenance needs attention—before the next budget meeting.
Six Government Fleet KPIs Every Director Should Know
Use the same definitions every month. Separate fleet-wide averages from vehicle-class results so a snowplow is not judged against a pool sedan.
Preventive maintenance compliance
Shows whether scheduled PM tasks were completed within the approved service window. Track overdue jobs and the number of days overdue alongside the percentage.
Vehicle availability
Measures how often vehicles are ready for assigned service. Define whether standby vehicles and planned downtime count before reporting the rate.
Maintenance cost per mile
Combines relevant maintenance labor, parts and outside services, divided by distance traveled. For low-mileage assets, use cost per engine hour instead.
Utilization rate
Indicates whether vehicles are being used enough to justify ownership. Base the calculation on assigned days, miles, engine hours or active use—whichever fits the fleet.
Unscheduled downtime
Tracks hours or days lost to unexpected repairs. Pair this with repeat failures and repair turnaround to find recurring reliability problems.
Work order completion and backlog
Shows how quickly maintenance demand is resolved and whether the shop is accumulating older work. Report open jobs by age and criticality, not just total count.
The Fleet Performance Compass
One strong metric cannot tell the whole story. Read readiness, cost, PM discipline and utilization together to avoid optimizing the wrong thing.
How to use the compass
Plot each vehicle class using its own baseline. Investigate outliers before changing replacement or staffing plans.
- Identify the vehicles in the high-cost / low-availability quadrant.
- Check overdue PM, repeat repairs and parts delays.
- Compare repair spend against age, duty cycle and replacement cost.
- Record a decision and review movement next month.
Conceptual quadrant, not an automated HVI feature or statistical benchmark.
Build Benchmarks from Your Own Fleet Baseline
There is no single defensible target for every government fleet. Duty cycles, seasonal peaks, vehicle age and service criticality change what “good” performance means.
Define
Fix the numerator, denominator, reporting period and exclusions.
Segment
Separate emergency response, heavy equipment and light-duty fleets.
Improve
Use a 6–12 month baseline, then set reviewed targets and owners.
Cost per Mile Is a Signal—Not a Verdict
For budget reviews, break the numerator into parts, labor and outside service before comparing one department to another.
When the number rises
Check mileage first. A lightly used vehicle can show a high cost per mile even with modest repair spend.
Inspect repeat repairs. Group work orders by asset and failure type to identify recurring costs.
Compare similar duties. Use engine hours for equipment whose work is not represented by road mileage.
From KPI Warning to Maintenance Decision
A director dashboard should tell the team what to investigate next—not simply display a red number.
HVI's preventive maintenance, inspections, maintenance records and reporting can help teams trace performance signals to underlying vehicle activity. Book a Demo to review which workflows and reports match your agency's needs.
A Monthly Fleet Scorecard for City Leadership
Give finance officers and city managers a short, repeatable view: current result, change, owner and next action. Keep detailed asset-level records behind the summary.
| Measure | Current | Prior | Direction | Next action |
|---|---|---|---|---|
| PM compliance | 92% | 88% | Improving | Maintain service cadence |
| Vehicle availability | 88% | 90% | Review | Inspect repeat downtime |
| Maintenance cost / mile | $0.31 | $0.29 | Review | Analyze parts and labor |
| Overdue PM jobs | 14 | 19 | Improving | Clear critical backlog |
Publish consistent definitions with the report. A trend can reverse simply because departments changed the way they record downtime or classify repair costs. For more operational context, see government fleet maintenance management.
Connect the Data Sources Behind Every KPI
Good dashboards start with disciplined records. Each KPI needs an operational source, an accountable owner and a repeatable review cadence.
Dashboard + maintenance reporting
Review PM status, inspection history, service activity and cost information in the context of the fleet.
Before adopting a new dashboard, confirm available filters, calculation methods, export formats and reporting views during a product demonstration. A clear reporting specification prevents misleading comparisons later.
Government Fleet KPI FAQs
What are the most important government fleet KPIs?
Start with PM compliance, vehicle availability, maintenance cost per mile or engine hour, utilization, unscheduled downtime and work order backlog. Add safety, replacement and service-level measures where they fit the agency's mission.
How do you calculate fleet preventive maintenance compliance?
Divide the number of PM services completed within the defined service window by the number due in the reporting period, then multiply by 100. Document how deferred, exempt and out-of-service vehicles are treated.
What is a good vehicle availability benchmark for a municipal fleet?
There is no universal percentage that fits every municipal fleet. Emergency vehicles, seasonal equipment and administrative vehicles have different readiness requirements. Start with historical availability by class, set a service-based target and review deviations monthly.
Should government fleets track maintenance cost per mile or per engine hour?
Use cost per mile for road vehicles where distance reflects workload. For stationary, low-mileage or off-road equipment, cost per engine hour may be more meaningful. Compare like assets using consistent cost definitions.
How can HVI help with government fleet KPI reporting?
HVI brings together fleet records, inspections, preventive maintenance, work orders and cost information to support performance review. During a demo, confirm the exact dashboard measures, filters and exports needed for your agency's reporting process.