Your council asks the question every budget cycle: is the money we spend on fleet maintenance actually saving us anything? If the honest answer is a shrug, you're not alone — most public fleets can't prove it because the numbers live in too many places. Measuring municipal fleet maintenance ROI isn't about a magic figure; it's about building a baseline and watching the right numbers move. Here's how to do it with vehicle-level data. Book a demo to see the cost reports finance would get.
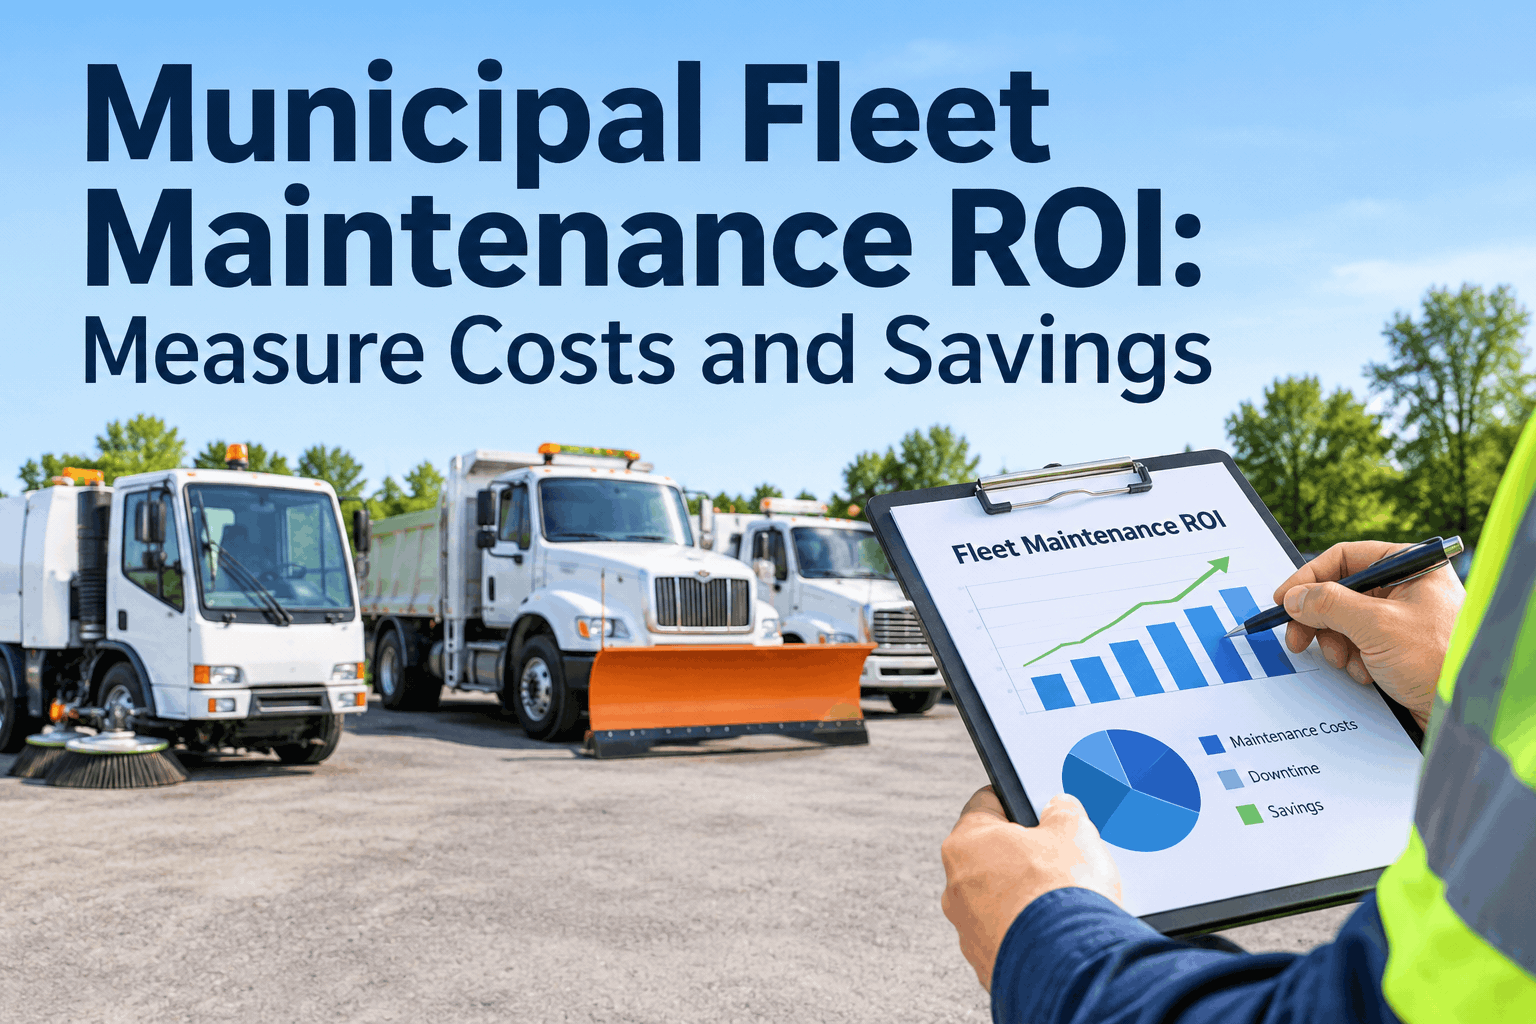
Municipal Fleet Maintenance ROI: Measure Costs and Savings
Turn scattered work orders, parts, labor and downtime into a baseline you can track — and prove what preventive maintenance returns, unit by unit, in a report finance and council will trust.
ROI isn't a single number you pull once — it's a comparison over time. You can't show a return if you never measured where you started, and you can't attribute savings to preventive maintenance if the cost data is fleet-wide averages instead of per-vehicle. A plow truck and a pickup don't cost the same to keep running, so an average tells the council almost nothing. Measuring municipal fleet maintenance ROI comes down to four moves: set a baseline, track the real costs, compare them as your PM program matures, and put the result in front of the people who approve the budget. None of it requires guesswork — just consistent records and the patience to let a full year of data accumulate.
How to measure maintenance ROIthe four-step method for government fleet cost analysis — baseline, track, compare, justify
Set a baseline
Capture what you spend now — maintenance, parts, labor and downtime — before anything changes. Without a starting line, there's no ROI to measure against.
Track costs per unit
Record every work order, part and labor hour against the vehicle, not the fleet. Per-unit data is the only way to see which units earn their keep and which drag the number down.
Compare over time
Watch cost per mile, downtime and repair frequency move as preventive maintenance matures. The gap between baseline and now is your return — measured, not projected.
Justify the budget
Export the per-unit cost and savings into a report finance can read. The same data backs a replacement case and a budget line — traced to records, not gut feel.
If you want the raw savings formula instead of the measurement method, our preventive maintenance ROI calculator covers the math; this page is about tracking the real numbers so the formula has something accurate to work with. You can book a demo to see the four steps on a sample fleet.
What goes into the ROI numberthe maintenance cost inputs a municipal fleet has to track per vehicle — and where each one hides
Parts costs
What each repair pulled from the shelf — often in a stockroom log that never ties back to the unit.
Labor hours
Technician time on each vehicle — invisible unless the work orders capture who did what, and for how long.
Downtime
Days a unit sat waiting on a repair — the cost that never shows on an invoice but hits service hardest.
Repair frequency
How often a unit comes back — a rising count is the clearest early signal of a vehicle costing more than it's worth.
Seeing all four together, per unit, is the cost-visibility side of this — covered in depth on our government fleet operating cost guide. This page picks up where that leaves off: once you can see the costs, you measure the return. Both run on the same fleet cost and reporting records.
Where the savings show upwhat measurably changes when a municipal fleet tracks maintenance costs per vehicle
- Costs known only as a fleet-wide total
- Breakdowns drive spend — reactive, not planned
- Replacement decisions made on age and gut feel
- No baseline, so no way to prove a return
- Cost per mile and per hour, measured by unit
- PM catches wear early — fewer costly breakdowns
- Repair-or-replace backed by each unit's real cost
- Baseline vs. now — a return you can show
The savings aren't a slogan — they're the measured gap between those two columns. Results depend on accurate, consistent records, so treat the trend as evidence, not a guarantee. For the broader software-payback case, our CMMS ROI and payback guide lays out the numbers, and a free trial lets you start your own baseline today.
Reading the cost-per-mile trendhow the ROI shows up in the numbers — baseline against a maturing PM program
The clearest ROI signal is cost per mile (or per hour) bending down over time as preventive maintenance replaces reactive repairs. The baseline is the flat line you're measuring against; the gap that opens below it is the measured return.
Baseline (flat)
Last year's cost per mile — the line every later quarter is measured against.
Actual (falling)
Cost per mile dropping as PM catches wear before it becomes a breakdown.
The gap = ROI
The measured distance between baseline and actual is your return, in real numbers.
This is a trend you build from your own records — HVI tracks the inputs, it doesn't promise a curve. Book a demo to see the cost-per-mile view on real units.
The report finance actually readswhat a municipal fleet maintenance ROI report looks like at the budget table
That export turns a maintenance budget from a line you defend into a case you make, and it draws on the same records as your municipal PM schedule — the program whose return you're measuring.
From a fleet director who had to prove the return
The first year I asked for more PM budget, I got laughed out of the room — I had no numbers, just a feeling that we were spending too much on breakdowns. So I set a baseline and tracked every cost per unit for a year. The next cycle I walked in with cost per mile down and downtime down against that baseline, all traced to records. Same ask, completely different meeting. You can't argue with a number you can trace back to a work order.
Municipal fleet maintenance ROI FAQs
Does HVI guarantee a specific maintenance ROI or savings figure?
No — HVI organizes the cost, downtime and work-order data so you can measure your own ROI; it doesn't promise a number. Results depend on accurate, consistent records. Book a demo to see what you'd be tracking.
How do I set a baseline for maintenance ROI?
Capture your current maintenance, parts, labor and downtime spend before changing anything, ideally over a full year to cover seasonal swings. That figure becomes the line every later period is measured against.
Why track costs per vehicle instead of fleet-wide?
Fleet-wide averages hide the units dragging the number down. Per-vehicle cost shows exactly where spend concentrates and backs a repair-or-replace case. Book a demo to see per-unit cost tracking.
What metrics best show maintenance ROI?
Cost per mile or per engine hour, unplanned downtime, and repair frequency, each tracked against your baseline. When those move the right way, the gap is your measured return.
Can I export the data for finance and council?
Yes — per-unit cost, the baseline trend and a replacement case export in one click, with every figure traced to a work order. Start free to build your first report.
Prove your municipal fleet maintenance ROI
Measure government fleet maintenance ROI with vehicle-level cost data — set a baseline, track parts, labor and downtime per unit, and export a report that backs the budget and the replacement case with records, not guesses.
No hardware · Per-unit cost tracking · Export-ready for finance & council