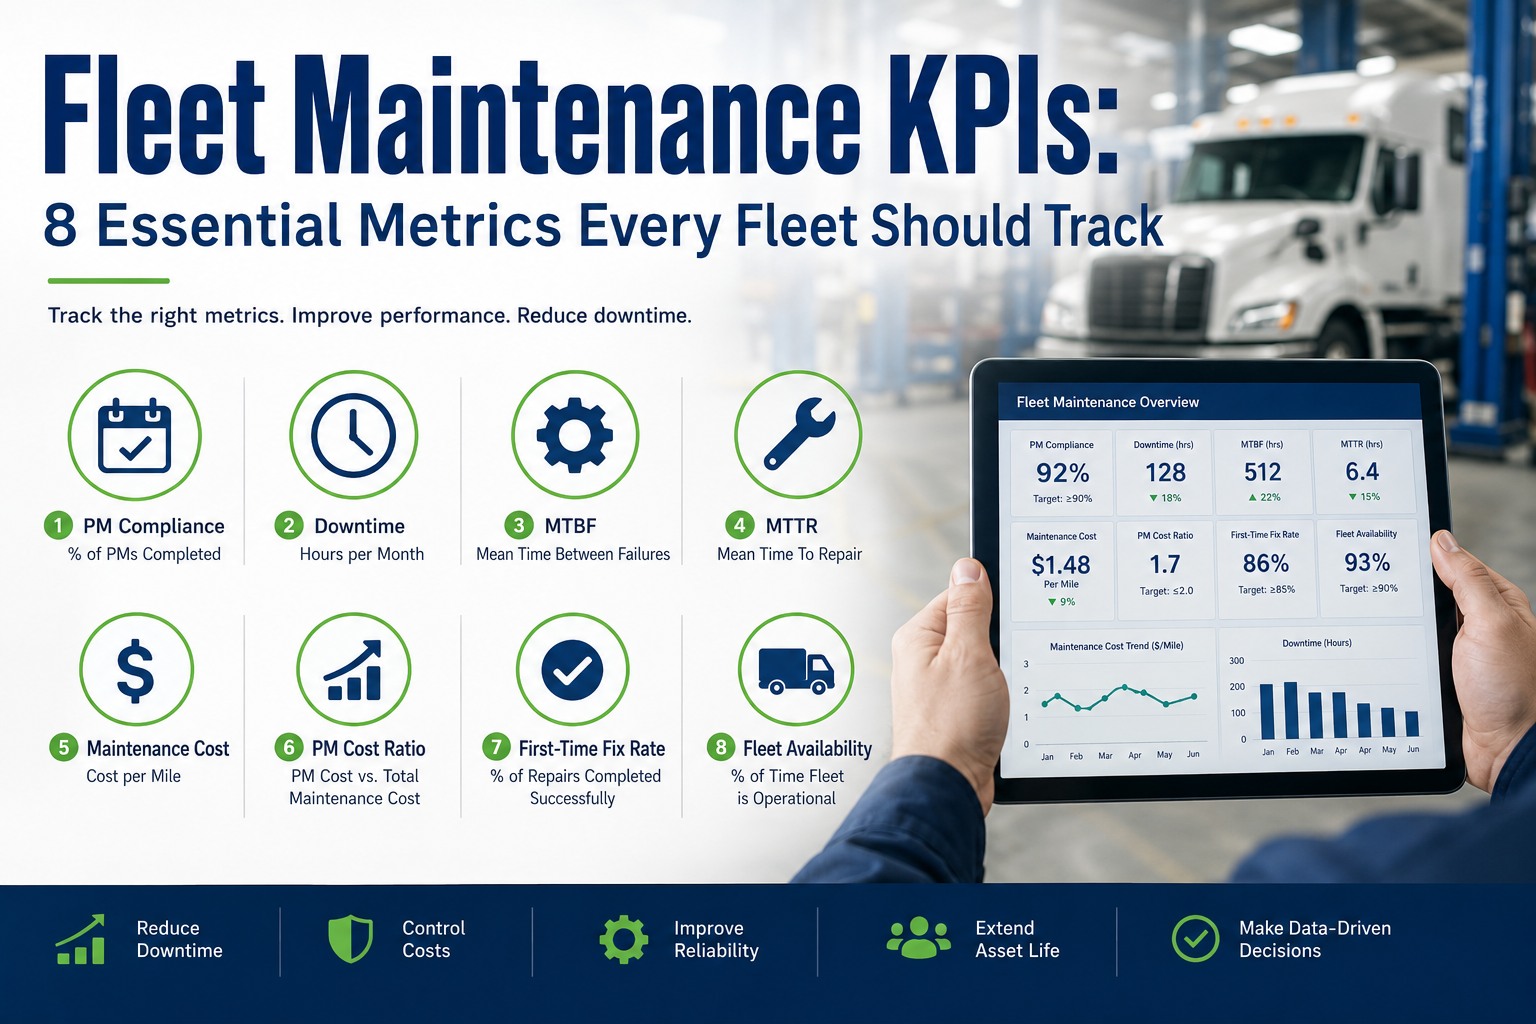
Fleet maintenance KPIs turn operational chaos into managed performance. The right 8 metrics tell a CFO whether maintenance is a cost center or a competitive advantage — and give the Maintenance Manager the exact levers to move. SMRP and AEMP standardize the framework: PM compliance, MTBF, MTTR, downtime %, CPM, parts availability, work order cycle time, and planned vs unplanned ratio. Fleets tracking all 8 deliver 30-40% lower R&M costs and 60-70% less unplanned downtime than fleets tracking none. Book an HVI demo to see all 8 on your dashboard.
Every KPI. One dashboard. Different levers for different problems.
Reliability. Cost. Efficiency. Quality. Each KPI measures a specific dimension of fleet maintenance performance — and together they diagnose exactly what's working and what isn't.
Why the right KPIs separate top-quartile fleets from the rest
Fleet maintenance KPIs are the language executives and shop floors share. Without them, "the trucks are breaking down too often" is opinion; with them, "unplanned downtime is 12% versus our 5% target" is a conversation with an owner and a fix. Top-quartile fleets don't outperform because they work harder — they outperform because they measure what matters and manage against the numbers.
SMRP (Society for Maintenance & Reliability Professionals), AEMP (Association of Equipment Management Professionals), and ISO 55000 (Asset Management Standard) all converge on the same core framework. Eight KPIs, three categories, one dashboard. Fleets that instrument all eight and publish them weekly to maintenance and quarterly to executives typically hit top-quartile benchmarks within 12-18 months — not because the numbers themselves fix anything, but because they surface which specific interventions produce the largest returns.
Shop floor and executive suite speak the same language when the metric is documented. Ends the "we've always done it this way" argument.
A KPI moving 5% in the wrong direction over 60 days signals a developing failure. Without the metric, the failure surfaces as a breakdown.
Comparing to ATRI, SMRP, and AEMP industry benchmarks shows how much room to improve exists. "Are we good?" becomes a specific question.
Metrics that get reported are the metrics that get managed. What isn't tracked stays broken; what gets tracked improves.
Book an HVI demo to see how executive dashboards convert raw maintenance data into decisions
The 8 essential fleet maintenance KPIs — what each one means
Each of the 8 KPIs measures a specific dimension of fleet maintenance performance. Together they produce a complete diagnostic picture. Individually they answer different questions: "Are we doing the work?" (PM compliance), "Is equipment reliable?" (MTBF), "Are we efficient?" (MTTR, work order cycle), "Is it cost-effective?" (CPM), "Do we have the parts?" (fill rate), "Are we planning ahead?" (planned ratio), "Is downtime under control?" (unplanned %).
Percentage of scheduled preventive maintenance completed within the 10% tolerance window. The single strongest leading indicator of fleet economics. Best-in-class: 90%+. Industry average: 70-85%. Under 60% signals systemic breakdown. Every 10-point improvement typically reduces R&M CPM $0.02-0.04 and cuts unplanned downtime 3-5 percentage points.
(PMs completed within 10% window ÷ Total PMs scheduled) × 100
Average operating time between equipment failures. Higher is better. Class 8 truck benchmarks: 65,000+ miles (world-class), 45,000-65,000 (best-in-class), 30,000-45,000 (average), under 30,000 (at-risk). MTBF trending downward indicates aging fleet, deteriorating PM discipline, or duty cycle mismatch. Correlates strongly with PM compliance and downtime metrics.
Total operating time ÷ Number of failures
Average time to complete a repair from work order creation to closure. Includes diagnostic, parts wait, active repair, and quality verification. Lower is better for the same repair scope. Benchmark against similar work types — a brake job MTTR versus an injector replacement are different comparisons. Best-in-class fleets track MTTR trending 15% year-over-year improvement.
Total repair time ÷ Number of repairs
Percentage of scheduled operating hours lost to unplanned repair events. The most CFO-facing metric. Best-in-class: under 5%. Industry average: 8-14%. Poor: 15%+. Each 1% reduction on a 100-truck fleet is worth roughly 250 revenue days annually. Direct dollar impact makes this the KPI most closely tied to executive attention.
(Unplanned downtime hours ÷ Total planned operating hours) × 100
Total repair and maintenance cost divided by miles driven. ATRI 2025 industry average is $0.215/mile; top-quartile fleets run $0.15-0.18; bottom-quartile $0.32+. Track separately by tractor age, duty cycle, and route type for meaningful benchmarking. Watch year-over-year direction rather than absolute number — direction reveals whether the program is improving.
Total R&M cost ÷ Total miles driven
Percentage of parts requests filled from stock on first request. Best-in-class: 95%+. Below 80% signals understocking; above 98% may signal overstocking. Fill rate correlates directly with PM compliance and MTTR — stockouts delay PMs and extend repair time. Track by ABC class for meaningful diagnostics.
(Parts requests filled from stock ÷ Total parts requests) × 100
Average elapsed time from work order creation to closure. Includes wait time (parts, bay, technician availability), active work time, and administrative closure time. Best-in-class fleets track WO cycle time separately for planned versus unplanned work. Planned WO cycle should improve 10-15% year-over-year with digital workflow adoption.
Sum of WO closure times ÷ Total closed work orders
Percentage of maintenance hours spent on planned work versus reactive breakdown response. Best-in-class: 80%+ planned. Industry average: 60-80%. Reactive fleets under 60%. The single best culture indicator — fleets that plan work stay ahead; fleets that react stay behind. Movement in this ratio predicts changes in every other KPI.
(Planned maintenance hours ÷ Total maintenance hours) × 100
The 8 KPIs are not independent variables. PM compliance drives MTBF drives unplanned downtime drives CPM. Parts availability drives MTTR drives WO cycle time. Planned ratio predicts all of them. Fleets that instrument the 8 together see the interdependencies and manage upstream causes rather than downstream symptoms. Start a free trial to test the full framework against your fleet.
Leading vs lagging indicators — why the distinction matters
Not all KPIs measure the same thing. Half tell you what already happened (lagging); half tell you what's about to happen (leading). Best-in-class fleets manage against leading indicators — the metrics that move first — and use lagging indicators to validate the outcomes. Fleets that track only lagging KPIs are always fixing problems after they show up in the numbers.
- PM Compliance Rate — moves first; predicts MTBF and downtime
- Parts Availability — moves first; predicts MTTR and WO cycle
- Work Order Cycle Time — trend reveals process health
- Planned vs Unplanned Ratio — culture indicator; predicts everything else
Leading indicators are what the Maintenance Manager can actually influence this quarter. They're the metrics on the tactical weekly review, driving specific corrective actions.
- MTBF — outcome of PM compliance and duty cycle
- MTTR — outcome of parts availability and skill
- Unplanned Downtime % — outcome of all leading indicators
- R&M Cost Per Mile — outcome of everything upstream
Lagging indicators are what the CFO and Fleet Director see. They validate whether the tactical work is producing strategic outcomes — but they can't be moved directly, only through their upstream leading indicators.
The distinction is not academic. A fleet reviewing only CPM and downtime monthly will chase symptoms; a fleet reviewing PM compliance and parts availability weekly will address causes. Best-in-class analytics platforms surface both categories with different cadences and different audiences. Book an HVI demo to see leading and lagging KPIs on separate dashboards
Building the dashboard — from data source to CFO-ready report
KPIs without a dashboard become quarterly PowerPoint decks that nobody uses. A functional fleet analytics dashboard is a workflow, not a report. Four architectural principles separate dashboards that drive decisions from dashboards that generate meetings.
KPIs calculated manually from spreadsheets are 30-60 days stale and prone to compilation errors. Automated pipelines pull from work orders, telematics, and inventory systems in real time. Trust in the numbers comes from automation, not from double-checking.
Weekly for maintenance team (leading indicators, tactical). Monthly for fleet management (all 8, trending). Quarterly for executives (lagging indicators, benchmarked against industry). Same data, different views, different decisions.
Executive sees "PM compliance dropped 3 points." Drill-down reveals which shop, which trucks, which PM types. Root cause visible without a data science team. Dashboards that stop at the summary don't produce action; dashboards that reveal the causes do.
Being 15% better than last year doesn't tell you if you're competitive. ATRI, SMRP, and AEMP publish benchmarks that show where top-quartile lives. Dashboards that compare only to internal history reward complacency; dashboards that compare to industry reveal opportunity.
Fleets that implement the four dashboard principles typically see leading indicators improve first (PM compliance and planned ratio within 60-90 days), followed by lagging indicators (downtime, CPM, MTBF) over the next 6-12 months. The sequence matters — leading indicators move first because they're the levers being actively pulled. Start a free trial to build the 8-KPI dashboard for your fleet.
From a Fleet Director who instrumented all 8 KPIs across 280 tractors
Before we built the dashboard, our monthly ops meeting was two hours of anecdotes. Somebody was frustrated about a truck; somebody else defended the shop; the CFO watched us go in circles. We had no shared numbers.
Six months after standing up the 8-KPI dashboard, our ops meetings run 45 minutes. We open on planned versus unplanned ratio — if it's below 75%, we spend the meeting on the 3 root causes the drill-down surfaces. If it's above 75%, we spend the meeting on trend improvements and industry benchmarks. PM compliance went from 71% to 88%. Downtime dropped from 11% to 6%. CPM fell $0.04. Same fleet, same team, same money — different visibility, different conversations, different outcomes.
Frequently asked questions
What are the most important fleet maintenance KPIs to track first?
Fleets starting a KPI program should prioritize the four leading indicators first: PM Compliance Rate, Parts Availability, Work Order Cycle Time, and Planned vs Unplanned Ratio. These are the KPIs the Maintenance Manager can influence directly through operational changes — and they predict the lagging indicators that CFOs care about. Start with PM Compliance Rate. It's the single strongest predictor of downstream economics. Every 10-point improvement typically reduces R&M cost per mile by $0.02-0.04 and cuts unplanned downtime 3-5 percentage points. Fleets that lift PM compliance from 70% to 90% see cascading improvements across MTBF, downtime, and CPM within 12 months. Second priority: Planned vs Unplanned Ratio. This is the culture indicator that predicts every other KPI. A fleet at 80%+ planned is proactively managing maintenance; a fleet under 60% planned is reactive firefighting. Movement in this ratio typically precedes movement in downtime and CPM by 60-90 days. Third: Parts Availability. Without parts, PMs slip and repairs extend. Fill rate below 95% will cap PM compliance improvement at whatever the storeroom can support. Fourth: Work Order Cycle Time. Reveals process health and shop efficiency. Add the four lagging indicators (MTBF, MTTR, Unplanned Downtime, CPM) once the leading indicators are stable and moving in the right direction — typically after 3-6 months of dashboard operation. Trying to instrument all 8 simultaneously usually results in none of them being tracked well.
How do you calculate MTBF and MTTR for a commercial fleet?
MTBF (Mean Time Between Failures) = Total Operating Time ÷ Number of Failures. For commercial trucks, "operating time" is typically measured in miles or engine hours rather than calendar time. If a fleet of 100 trucks accumulated 10 million miles over 12 months and experienced 220 unplanned failures, MTBF = 10,000,000 ÷ 220 = 45,454 miles. Higher is better. Class 8 truck benchmarks: world-class fleets achieve 65,000+ miles MTBF; best-in-class 45,000-65,000; industry average 30,000-45,000; at-risk fleets under 30,000. MTBF trending downward signals aging fleet, deteriorating PM discipline, or duty cycle mismatch — investigate before the trend translates to breakdown cost. MTTR (Mean Time To Repair) = Total Repair Time ÷ Number of Repairs. "Repair time" should include diagnostic time, parts wait time, active repair time, and quality verification time — the full duration from work order creation to closure. Track MTTR separately by work type: brake job MTTR versus injector replacement MTTR versus PM MTTR are different comparisons. Best-in-class fleets track MTTR trending 15% year-over-year improvement for the same work types as digital workflow adoption reduces administrative overhead and better parts availability reduces wait time. MTTR without work type segmentation produces noise; MTTR by work type produces actionable insight into shop efficiency, parts availability, and technician skill development. Digital fleet analytics platforms automate both calculations from work order data — no manual tabulation required.
What's the difference between leading and lagging maintenance KPIs?
Leading indicators predict what's about to happen. Lagging indicators confirm what already happened. Both matter — but they serve different purposes and belong on different management reports. Leading indicators include PM Compliance Rate, Parts Availability, Work Order Cycle Time, and Planned vs Unplanned Ratio. These are the metrics the Maintenance Manager can actively influence this week through operational discipline and process changes. When a leading indicator moves in the wrong direction, corrective action can prevent the downstream lagging indicators from following. Leading indicators belong on the tactical weekly review, driving specific corrective actions. Lagging indicators include MTBF, MTTR, Unplanned Downtime Percentage, and R&M Cost Per Mile. These are outcome metrics — they reflect the results of whatever the leading indicators looked like 30-90 days ago. Lagging indicators can't be moved directly; they can only be moved by first moving their upstream leading indicators. Lagging indicators belong on the executive quarterly review, validating whether the tactical maintenance discipline is producing strategic business outcomes. Best-in-class fleets manage against leading indicators — PM compliance, parts availability, planned ratio — and use lagging indicators to validate outcomes. Fleets that track only lagging indicators are always fixing problems after the numbers reveal them. The management value in KPIs comes from the leading-to-lagging cascade, not from any single metric. A dashboard that shows only downtime and CPM is missing the levers that actually move them.
What benchmarks should I use for fleet maintenance KPIs?
Three authoritative sources publish fleet maintenance benchmarks: ATRI (American Transportation Research Institute), SMRP (Society for Maintenance & Reliability Professionals), and AEMP (Association of Equipment Management Professionals). ATRI publishes the industry's most cited annual "Operational Costs of Trucking" report covering cost-per-mile benchmarks for Class 8 tractors across duty cycles. ATRI's 2025 R&M cost per mile average was $0.215; top-quartile fleets ran $0.15-0.18; bottom-quartile $0.32+. SMRP publishes standardized maintenance KPI definitions and industry benchmarks across PM compliance, MTBF, MTTR, and planned versus unplanned ratios. Their benchmarks: PM Compliance world-class 90%+, best-in-class 85-89%, average 70-84%. Planned versus unplanned world-class 80%+, average 60-80%. AEMP publishes equipment management benchmarks specifically for construction, mining, and vocational fleets — critical for non-highway operations. ISO 55000 provides the international asset management framework that underlies both SMRP and AEMP methodologies. For applied use, benchmark against ATRI for cost metrics (CPM), SMRP for maintenance efficiency metrics (PM compliance, MTBF, MTTR, planned ratio), and AEMP for vocational-specific equipment metrics. Benchmarking against internal history alone rewards complacency; benchmarking against industry reveals whether the fleet is competitive. The most important benchmarking discipline is comparing to your own duty cycle and asset class — a refuse fleet won't hit long-haul MTBF numbers, but it should hit top-quartile refuse-specific benchmarks. Digital fleet analytics platforms integrate industry benchmarks directly into dashboards so the comparison is automatic.
How often should fleet maintenance KPIs be reviewed?
Different KPIs deserve different review cadences based on how quickly they move and who acts on them. Weekly review is for the maintenance team focused on leading indicators. PM Compliance Rate, Parts Availability, Work Order Cycle Time, and Planned vs Unplanned Ratio should be reviewed weekly by the Maintenance Manager and shop foremen. These metrics move fast enough that monthly review misses the corrective window. Weekly cadence catches trend changes at 3-5 percentage points rather than 15-20 percentage points. Monthly review is for fleet management focused on trend health. All 8 KPIs get reviewed monthly by Fleet Director and Operations Manager — with drill-down into which trucks, shops, or work types are driving movement in the aggregate numbers. Monthly cadence captures duty cycle changes, seasonal patterns, and the emergence of systemic issues that don't show at the weekly view. Quarterly review is for executives focused on lagging indicators and strategic outcomes. CFO and Fleet CEO see MTBF, Unplanned Downtime, CPM, and MTTR trended against industry benchmarks. Quarterly cadence connects maintenance performance to business outcomes and validates whether the maintenance program is delivering the strategic value the operating budget assumes. Best-in-class fleets never report only monthly or only quarterly. The three cadences serve different audiences and different decisions. Weekly = tactical corrections; Monthly = trend management; Quarterly = strategic outcomes. Trying to run all decisions on one cadence collapses either the tactical or the strategic layer. Digital fleet analytics platforms automate the three-tier reporting cadence so the appropriate view reaches the appropriate audience without manual report compilation.
From gut-feel to top-quartile — all 8 KPIs, one dashboard, three weeks.
HVI's fleet analytics module ships with all 8 SMRP/AEMP-standard KPIs pre-configured with industry-benchmark targets. Executive dashboards trend each metric weekly, monthly, and quarterly. Drill-down surfaces per-truck, per-shop, and per-technician root cause. ATRI benchmark integration shows where your fleet lands versus top-quartile. Live for your fleet in under three weeks — typical result: PM compliance up 15-25 points, unplanned downtime cut 30-50%, and R&M CPM falling into top-quartile territory within 12 months.
SMRP/AEMP methodology · ATRI benchmarks built-in · Multi-tier reporting cadence · SOC 2 Type II