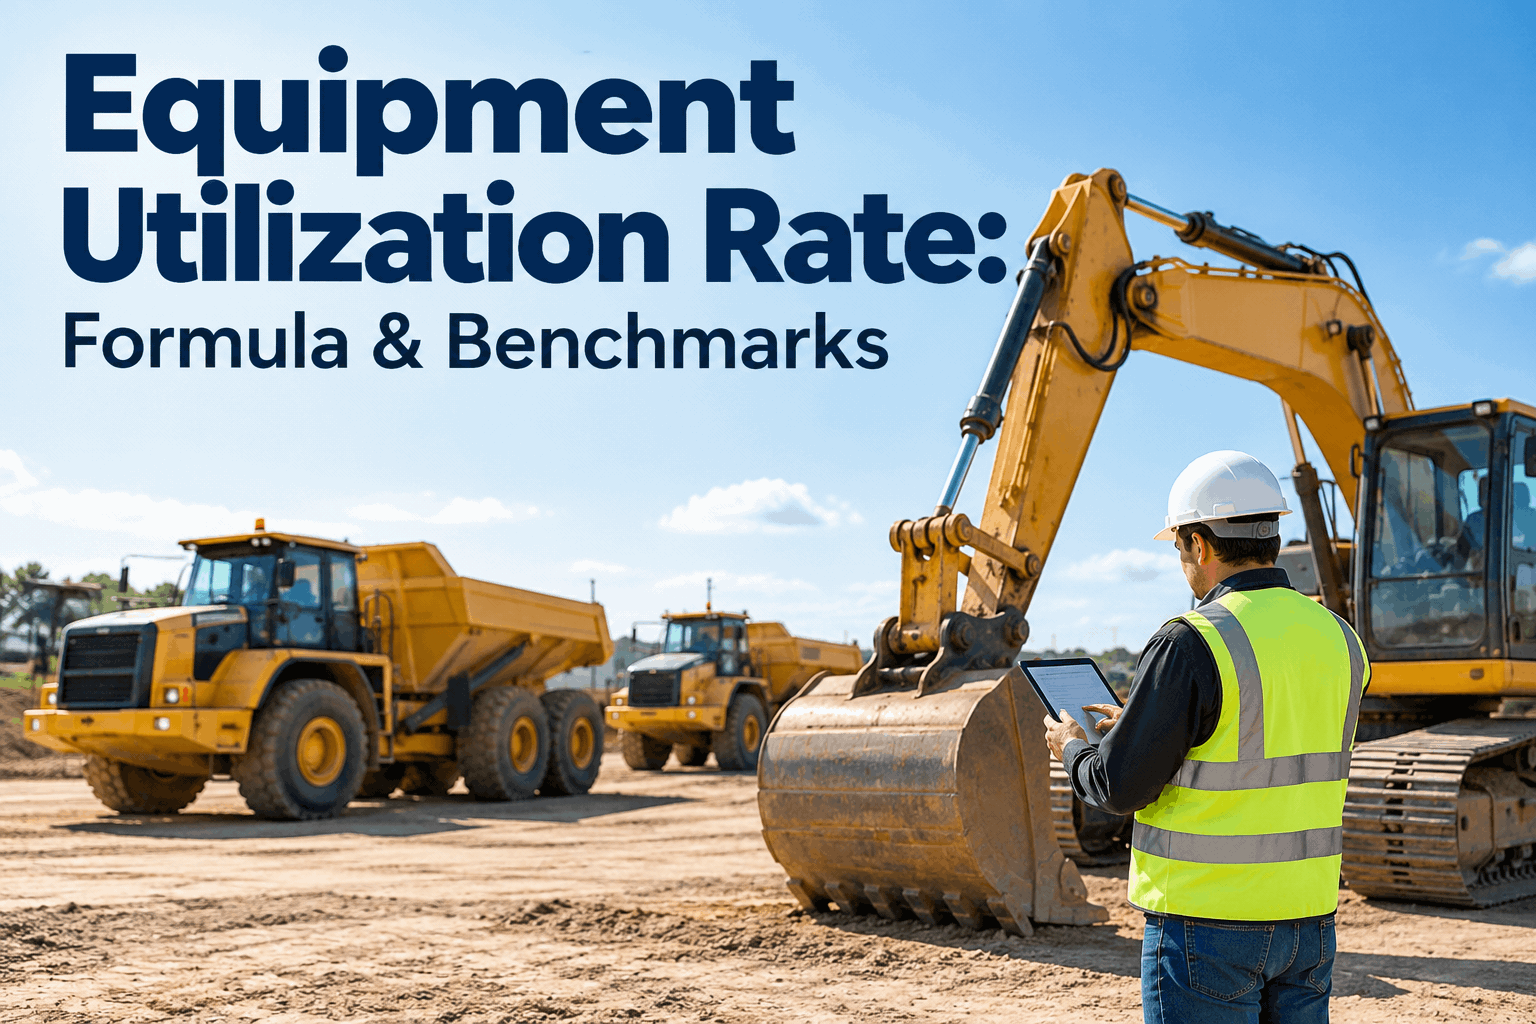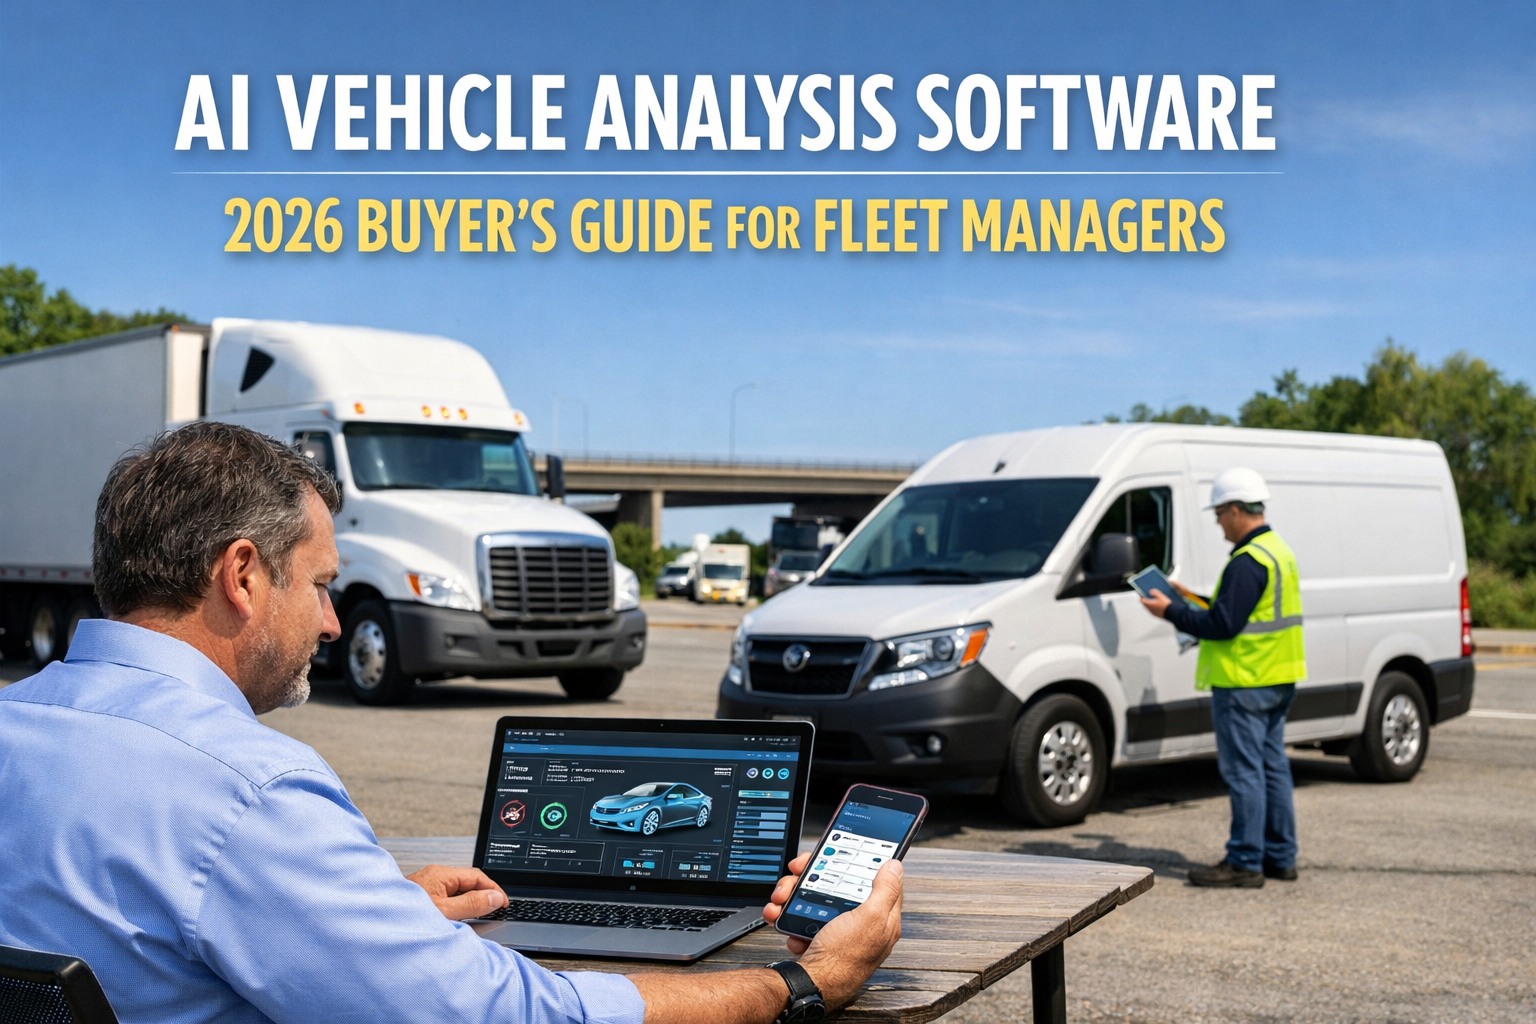
Most fleet managers know their vehicle count. Very few know their fleet utilization rate — and that gap is where millions in idle assets quietly disappear. Fleet utilization measures how effectively your vehicles are being used against available capacity. Industry benchmarks put a healthy rate at 60–80%, yet the average fleet runs at 55–65% — meaning roughly one in three assets is costing money without earning it back.
Fleet Utilization & Right-Sizing
Measure. Identify. Right-size. A complete guide for Fleet Managers, CFOs,and Fleet Directors.
What Is Fleet Utilization — And Why Does It Cost You Money?
A vehicle sitting idle is still costing you insurance, depreciation, maintenance reserves, and financing — with zero revenue offset. Multiply that across a 50-vehicle fleet where 15 assets are consistently underused, and you have a significant, visible cost problem with a straightforward data solution. See how HVI centralizes operating, fuel, and maintenance data to make this analysis possible in hours, not weeks.
Fleet Utilization Benchmarks — Where Does Your Fleet Sit?
Benchmarks vary by fleet type and mission. A construction fleet running 72% is healthy; a government fleet at 72% may actually be understaffed on spares. Use these industry ranges as your starting comparison — then drill to per-vehicle data to find the real story.
How to Identify Underutilized Vehicles in Your Fleet
Gut feel is not a right-sizing tool. These four data signals reliably surface underused assets — the vehicles your budget is carrying without adequate return. Track each signal over a 3-month rolling window before making any disposal or redeployment decision.
Days Idle Per Month
Any vehicle unused for more than 8–10 days per month consistently warrants review. Single-month dips can be seasonal — pull 3 months.
Cost Per Operating Hour
Divide total ownership cost by actual operating hours. High fixed costs + low hours = disproportionate cost per hour against fleet class average.
Fuel Consumption vs Output
Low fuel consumption + high ownership cost = underused asset. Vehicles refuelling infrequently but showing normal maintenance costs are likely idle.
Location Concentration
Multiple same-type vehicles at one site while another site regularly rents externally is a redeployment opportunity — not a fleet size problem.
Fleet Right-Sizing: 4 Decisions for Every Underutilized Asset
Once identified, every underutilized vehicle has exactly four possible outcomes. The right decision depends on asset age, replacement cost, seasonal demand patterns, and operational criticality. Use HVI's asset cost and utilization analytics to run this per-vehicle with real operating data — not spreadsheet guesses.
Redeploy
Move the asset to a higher-demand location. Best when no rental spend exists at the destination and the asset is fit for that work type.
Dispose / Sell
Sell or auction the asset. Removes fixed costs permanently. Best for older assets past optimal replacement age with remaining residual value.
Switch to Rental
Eliminate year-round fixed costs. Rent only for peak periods. Ideal when seasonal demand spikes to 3+ months with very low off-peak activity.
Retain as Spare
Valid only with a documented spare ratio policy — typically 1:10 for critical equipment. Not a default for indecision or "just in case" thinking.
"We had 48 vehicles in our field service fleet. Our first proper utilization analysis in HVI found 11 vehicles averaging below 42% over 6 months. We redeployed 4, sold 5 at decent residual values, and converted 2 to rental for peak months. Fleet went from 48 to 39 vehicles, serving identical operational demand. Annual saving: over $120,000 in ownership costs. The CFO approved a fleet analytics budget on the spot — the ROI was visible in a single dashboard."
See Your Fleet's Utilization — Asset by Asset, Right Now
HVI pulls operating hours, fuel logs, maintenance records, and asset data into one dashboard. Rank every vehicle from highest to lowest utilization. Start right-sizing from data, not instinct.
6 Fleet Utilization Metrics Every Fleet Manager Must Track
A single utilization percentage is not enough. These six metrics together give you the complete picture — from cost per hour to spare ratio — that supports evidence-based fleet planning and CFO-level right-sizing decisions.
How HVI Supports Fleet Utilization Analysis & Right-Sizing
HVI connects operating hours, fuel logs, inspection records, and maintenance work orders to each asset — giving fleet teams the data foundation to calculate real utilization rates, not estimates, and to produce right-sizing recommendations their CFO and board will trust.
Operating Data in One Place
Hours, mileage, and activity data from inspections, fuel logs, and maintenance work orders — all connected to each asset record automatically.
Asset-Level Cost Analysis
See total ownership cost per vehicle — fuel, maintenance, parts — against actual operating hours to calculate real cost per hour, not estimates.
Underutilization Flags
Set utilization thresholds per vehicle class. HVI surfaces assets falling below your target and ranks them so the right-sizing conversation starts with data.
Location-Level View
Compare utilization by site, department, or region. Identify where fleet is concentrated vs where demand is unmet — the redeployment map.
Trend & Seasonal Reporting
12-month rolling utilization by vehicle — so seasonal dips don't trigger wrong disposal decisions, and true underperformers are clearly separated.
CFO-Ready Export
One-click utilization and cost reports formatted for CFO and board-level fleet right-sizing presentations — not raw data dumps.
Conclusion — A 12% Smaller Fleet That Does the Same Work
Fleet utilization is the number that tells you whether your fleet is the right size for what your operations actually demand. The formula is simple. The data requirements are achievable. Fleets acting on utilization analysis consistently achieve 10–15% fleet size reduction while maintaining or improving service levels. HVI gives fleet managers the operating, fuel, and maintenance data needed to make that analysis credible — and the right-sizing decision defensible to your CFO.
Identify Underutilized Assets & Right-Size Your Fleet with HVI
Fleet managers, CFOs, and Fleet Directors use HVI to centralize operating data, calculate real utilization rates per asset, and build evidence-based right-sizing cases — from a single dashboard.