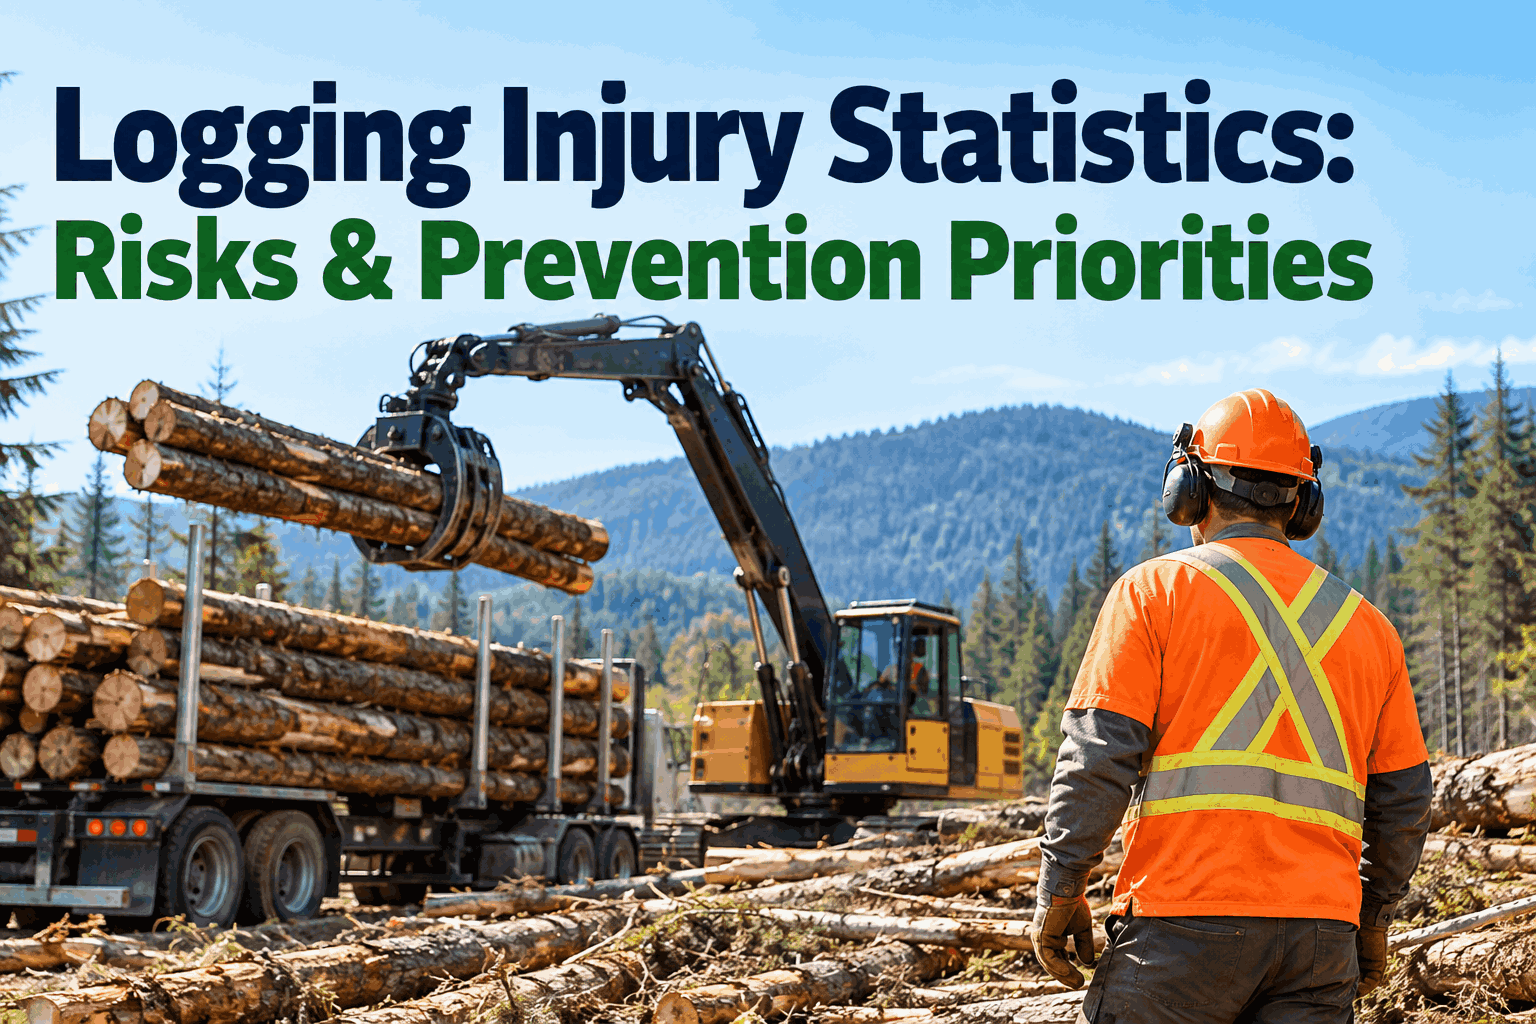
Logging injury statistics show why timber harvesting safety requires more than a general safety policy. Current U.S. fatality data place logging workers among the country's highest-risk occupations, while felling, moving timber, heavy equipment, difficult terrain,and changing site conditions create several serious exposures that crews must manage together.
What Logging Injury Statistics Mean for Prevention
National statistics show the scale of occupational risk. The practical value comes from turning that context into better inspections, hazard controls, training and follow-through in your own logging operation.
100,000 FTE workers
The Bureau of Labor Statistics recorded 51 fatal work injuries among logging workers in 2024 and a fatal work injury rate of 110.4 per 100,000 full-time equivalent workers. The corresponding rate across all U.S. workers was 3.3. These figures provide industry context, but a contractor still needs its own field records to identify where prevention attention is needed.
Understanding the Logging Injury Statistics
One important detail is that BLS occupational and industry statistics measure different populations. In 2024, occupational data recorded 51 fatal work injuries among logging workers, while industry data recorded 59 fatal work injuries in establishments classified within the Logging industry, NAICS 1133.
Fatal work injuries among workers classified in logging occupations.
Fatal work injuries within establishments classified in the logging industry.
Keep occupation and industry measures separate when comparing logging fatality statistics. The definitions and populations are not interchangeable.
National numbers are most useful when they are paired with your own incidents, near misses, inspections and unresolved findings. See how HVI can organize logging safety records into one reviewable field history.
Where Logging Safety Risk Builds in the Field
Logging work brings several high-consequence exposures into the same operating environment. Instead of treating them as isolated safety topics, supervisors need visibility across the complete harvest operation.
Conditions vary by operation, terrain, equipment and task. These categories provide a practical way to organize field observations and prevention work.
Tree condition, danger trees, direction of fall, retreat paths and worker positioning.
Equipment condition, guarding, operating zones, visibility and worker separation.
Rolling, sliding, shifting and suspended material during handling and loading.
Slope, footing, travel routes and ground conditions affecting workers and machines.
Wind, storms, fog, snow, darkness and other conditions that change work exposure.
Vehicle movement, equipment interaction and travel within and between logging areas.
OSHA 1910.266 addresses areas including environmental conditions, work areas, machines, vehicles, tree harvesting and employee training. A structured safety management process can help keep the records connected with those field activities organized.
Turn Logging Safety Statistics Into Prevention Priorities
The goal is not to repeat a national fatality rate in every safety meeting. The goal is to use the broader risk picture to decide what supervisors should repeatedly inspect, verify and follow through on during daily operations.
Verify tree condition, danger trees, work positioning, retreat paths and changing site conditions.
Hazard & task recordsCheck shift-start inspections, defects, brakes, guarding and protective structures.
Inspection recordsReview worker location and interaction with operating machines and adjacent work areas.
Field observationsConnect task hazards and recurring findings with training, repairs and assigned actions.
Training & safety recordsOSHA requires logging machines to be inspected before initial use during each workshift, and defects affecting serviceability must be addressed before the machine is used. See how HVI can connect logging equipment inspections with maintenance and safety follow-through.
Track Safety Signals Before They Become Outcomes
Fatality and injury statistics are lagging measures—they describe events that have already occurred. Day-to-day safety management also needs operational signals that supervisors can review while there is still an opportunity to intervene.
These records can help expose gaps in inspection, recurring conditions and incomplete follow-through before they disappear into separate forms or spreadsheets.
Look for missed, incomplete or late field and equipment inspections.
Identify defects or unsafe conditions appearing repeatedly across records.
Review issues that remain unresolved beyond the expected response period.
Review previous events for recurring tasks, equipment, locations or operating conditions that deserve additional attention.
No single metric proves that an operation is safe or unsafe. Review several indicators together and investigate the work conditions behind the numbers.
Analytics and reporting in HVI can help teams review operational records across inspections, findings and follow-up activity. See how HVI can make your logging safety trends easier to review from field records.
Close the Loop After an Incident or Safety Finding
A useful safety record should influence what happens next. When an incident, near miss, equipment defect or unsafe condition is documented, the lesson should flow back into inspection, work planning, maintenance or training instead of ending as an isolated report.
Record the event, defect, near miss or unsafe condition.
Identify the task, equipment and conditions connected with the finding.
Assign inspection, repair, training or another appropriate response.
Confirm completion and retain the supporting safety record.
OSHA logging training requirements address safe performance of assigned tasks, safe use and maintenance of tools, machines and vehicles, and recognition and control of hazards associated with the employee's work. A documented follow-through process helps make the operational response visible without treating software itself as proof of OSHA compliance.
Logging Injury Statistics: Frequently Asked Questions
What was the logging worker fatality rate in 2024?
The U.S. Bureau of Labor Statistics reported a fatal work injury rate of 110.4 per 100,000 full-time equivalent workers for logging workers in 2024. BLS recorded 51 fatal work injuries for the occupation that year.
How does the logging fatality rate compare with the U.S. workforce overall?
The 2024 logging-worker rate of 110.4 fatal work injuries per 100,000 FTE workers was about 33 times the 3.3 rate reported across all U.S. workers. This comparison describes occupational risk at a national level rather than predicting the risk of an individual contractor or employee.
Why do logging fatality statistics sometimes show different totals?
BLS publishes data by occupation and by industry. In 2024, occupational data recorded 51 fatalities among logging workers, while the Logging industry, NAICS 1133, recorded 59 fatal work injuries. The two measures use different classification scopes.
What should logging companies prioritize for injury prevention?
Priorities should reflect the company's actual operations and findings. Common areas requiring attention include felling practices, danger trees, work-area separation, machine condition, environmental conditions, employee training and follow-through on identified hazards.
How can HVI support logging injury prevention?
HVI can help organize digital inspections, safety records, equipment findings, follow-up actions and reporting so teams can review their own operational safety information alongside broader industry statistics. HVI does not predict incidents or independently determine OSHA compliance.
Turn Safety Records Into Clearer Prevention Priorities
Use HVI to connect inspections, safety findings, equipment records and follow-up activity so logging teams can see where attention is needed across their own operations.