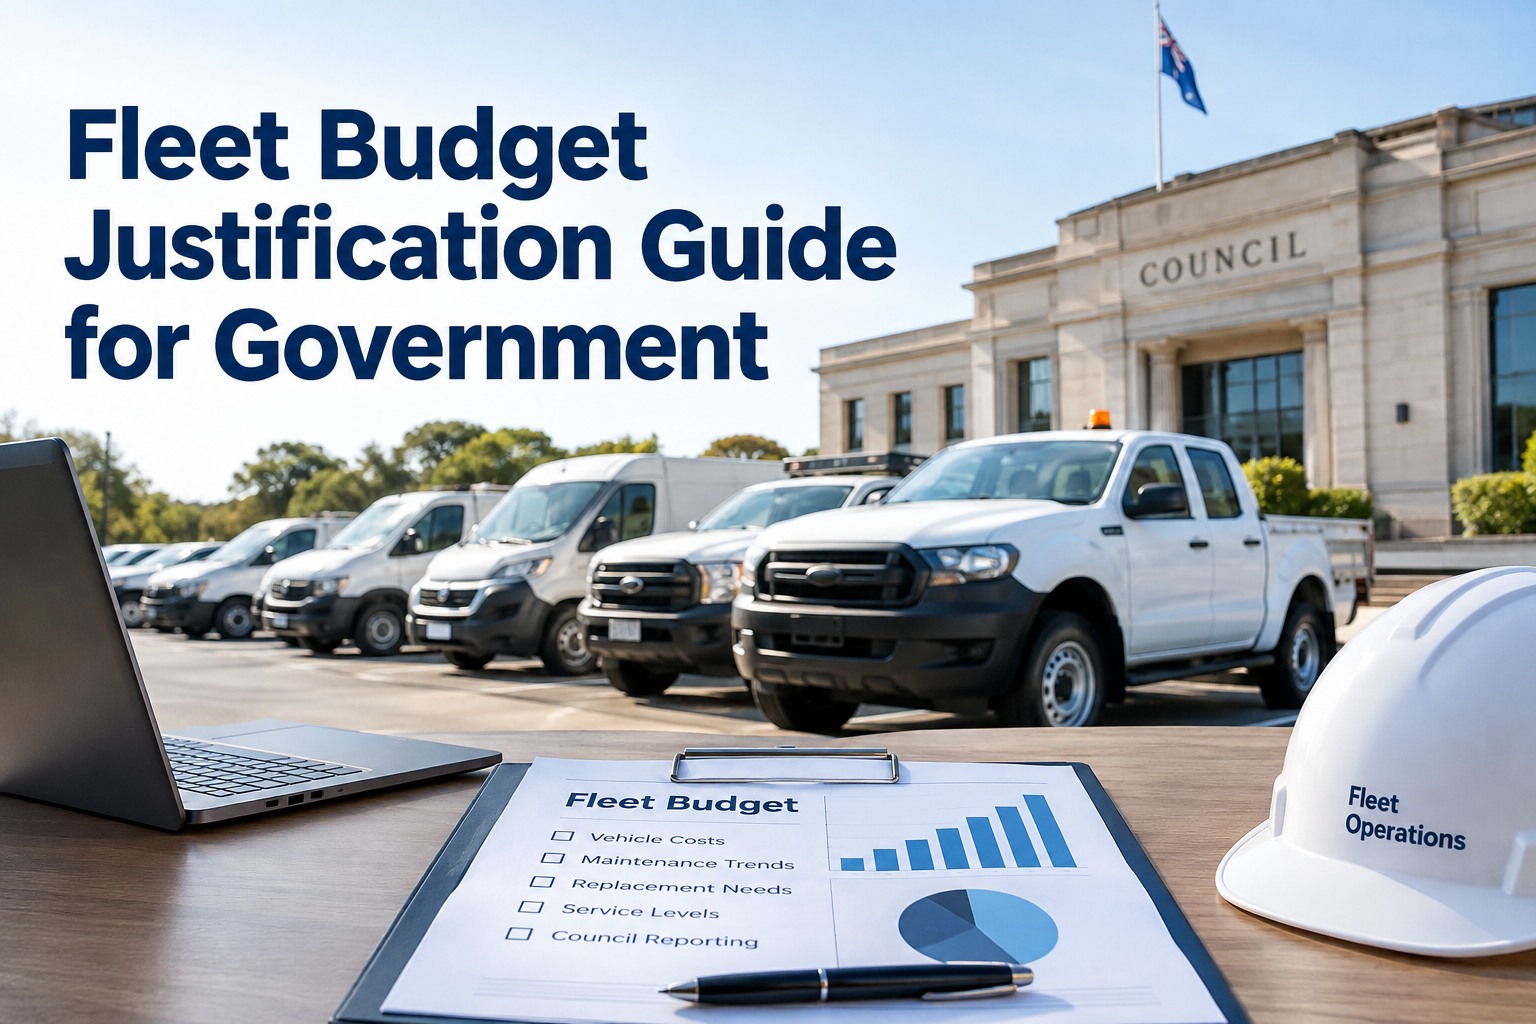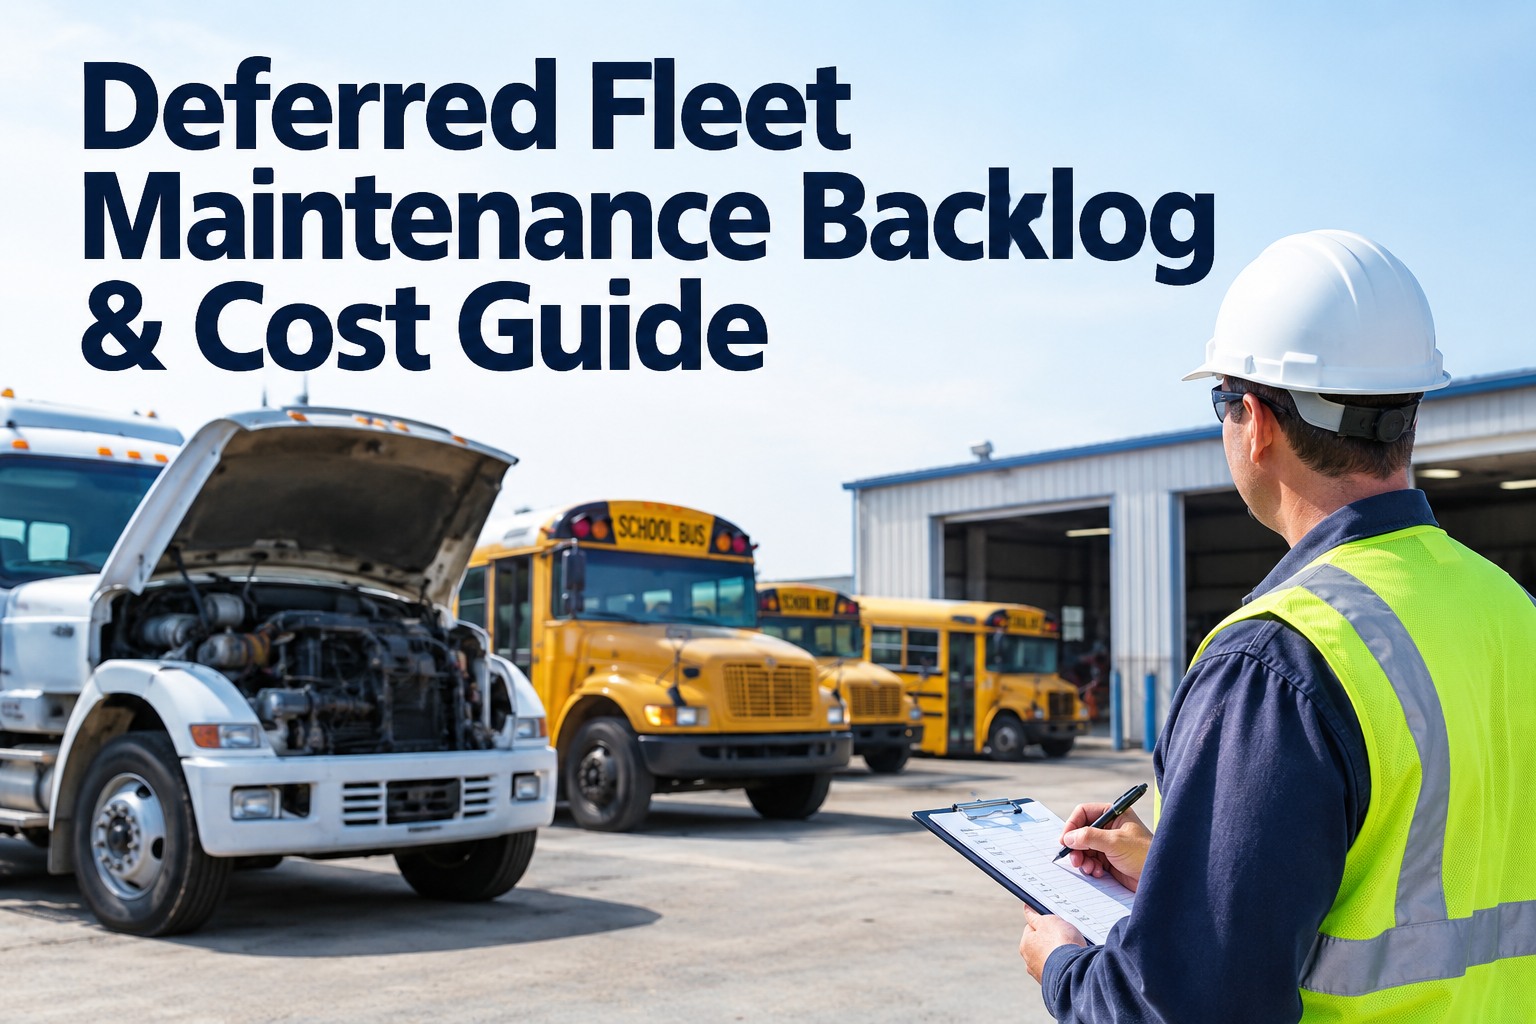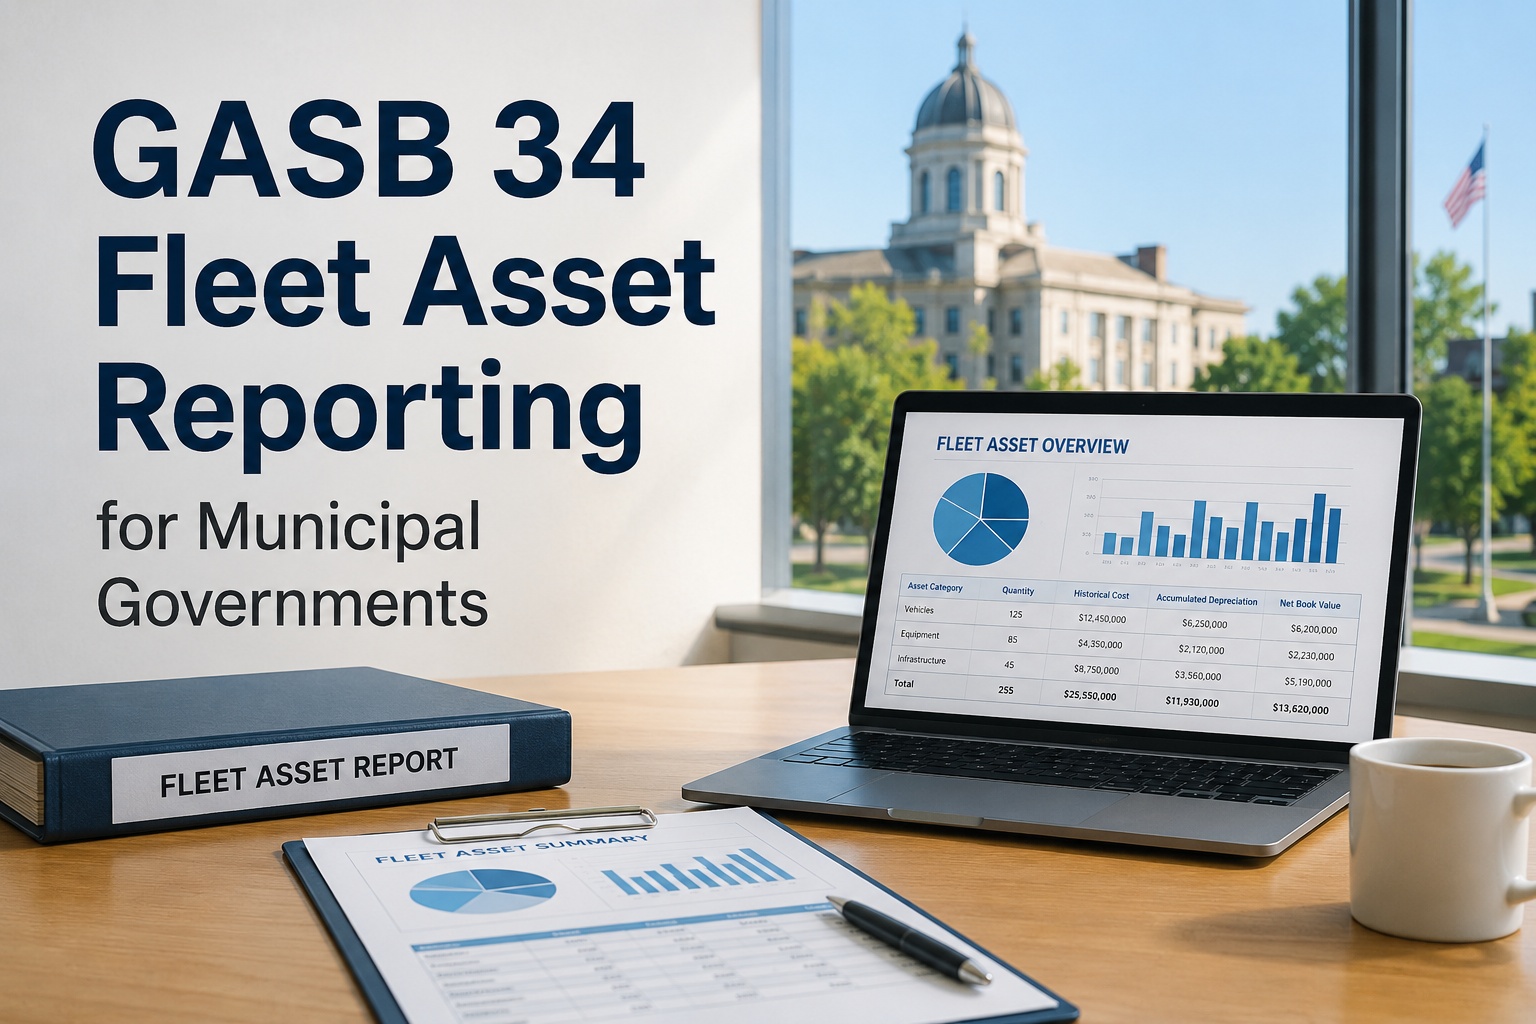
Budget season rolls around, and every fleet director has the same conversation: "We need more for maintenance" — and finance asks how much, for what. That is the moment a real deferred maintenance backlog government funding request either gets approved or gets pushed another year, and it comes down to whether anyone can show the number, tiered by risk and backed by records. This guide shows how to cost a public fleet's backlog the way a finance officer wants to see it. See how HVI turns backlog records into a cost report
That last line is the real problem. Most public agencies aren't short on backlog — they're short on a documented, costed version of it that a budget committee can actually vote on.
Why "We Need More Maintenance Money" Never Wins the Hearing
Say it in a budget meeting and watch what happens: a finance officer asks "how much, for what, and what happens if we don't fund it" — and the conversation usually stalls there. Not because the need isn't real, but because nobody walked in with a costed government fleet maintenance backlog that answers those three questions on paper. A vague ask competes with every other department's vague ask. A costed, risk-ranked ask competes on evidence, and evidence wins budget lines.
The ask that gets deferred again
- "Our trucks need more maintenance funding this year"
- No total dollar figure, no source document
- Safety items mixed in with routine deferrals
- No comparison to last year's backlog size
- Relies on a department head's word
The ask that gets funded
- "$340,000 to close 118 overdue work orders, ranked by risk"
- Line-item cost estimate, per vehicle, per tier
- Safety-critical items separated and costed first
- Trend line showing backlog growing or shrinking
- Pulled straight from inspection and work order records
The gap between those two columns is a costing exercise, not a bigger budget. HVI's analytics and reporting dashboard is built to generate the second column automatically from the inspection and work order data your shop is already producing. If you haven't yet logged and dated every open item, start with tracking and quantifying the backlog itself before you build the cost model below — the two go hand in hand.
The Three-Tier Cost Model: Not Every Dollar Escalates the Same Way
Here's the mistake most backlog spreadsheets make: they treat every deferred item as if it grows in cost at the same rate. It doesn't. A cracked mirror and a leaking brake line are both "deferred maintenance," but one sits quietly for a year with no change in price, and the other can turn a $400 repair into a $4,000 one — or an out-of-service vehicle — in a single season. Costing the backlog accurately means splitting it into tiers first.
Tier 1 · Safety-Critical
Brakes, steering, structural defects, anything with a plausible path to an out-of-service condition or roadside failure.
Budget these first, regardless of today's dollar estimate.
Tier 2 · Operational
HVAC, hydraulics, PTO systems, anything that doesn't block the vehicle legally but limits what it can do on a job.
Budget in the current or next cycle, before it becomes Tier 1.
Tier 3 · Routine / Cosmetic
Interior wear, minor body damage, non-functional accessories — items that don't affect safety or uptime.
Budget opportunistically, lowest priority for emergency funds.
Once a backlog is split this way, the budget conversation changes shape entirely. Instead of "we need $340,000," the request becomes "$190,000 closes every Tier 1 item this quarter, and the remaining $150,000 covers Tier 2 before it migrates up a tier." Finance officers fund risk-ranked requests far more readily than flat totals, because the tiering itself is the evidence that the number was built carefully rather than padded. Walk through how HVI auto-tags deferred items by risk tier as they're flagged during inspection.
Building the Budget Line: Five Steps From Backlog to Request
Costing the backlog is only half the job — it still has to land in front of finance as a document they can attach to a budget resolution. Here's the sequence that turns a maintenance list into a capital or operating request that holds up under questions.
-
1
Pull every open item with its age
Start from inspection and work order records, not memory. Every deferred item needs a date it was first flagged — age is the single clearest signal of which items are about to jump a cost tier.
-
2
Assign a tier and a labor-plus-parts estimate
Use the three-tier model above. A rough estimate attached to every line is worth more to finance than one precise number with eighty undated items behind it.
-
3
Roll totals up by tier and department
A single backlog number tells finance little. A breakdown by tier, and by the department whose budget line it affects, tells them exactly where the money needs to go and why.
-
4
Model the trend, not just the snapshot
Show last quarter's total next to this quarter's. A backlog that's shrinking tells a very different funding story than one that's silently growing — and it's the strongest argument for sustained funding rather than a one-time catch-up.
-
5
Attach the source records
A council or finance committee trusts a number more when the underlying work orders and inspection reports are available on request, not reconstructed after the fact from memory and paper.
Most of this work is manual when it's pulled from paper work orders and a maintenance shop's memory — which is exactly where backlog requests stall out before budget season. A connected maintenance management system that captures the tier, age, and cost at the moment an item is flagged turns this five-step process into a report that's ready before anyone asks for it. Book a demo to see this five-step report built from a real fleet's data rather than a mocked-up example.
Modeling a Multi-Year Glide Path (Illustrative Example)
A single year's funding rarely clears a backlog that took several years to build. Finance officers respond well to a multi-year "glide path" — a model showing the backlog shrinking on a defined schedule, with a dollar figure attached to each year. Below is an illustrative model for a 120-vehicle municipal fleet carrying a $340,000 starting backlog, built using the tiering approach above.
| Budget Year | Funding Requested | Items Closed | Remaining Backlog |
|---|---|---|---|
| Year 0 (current) | — | — | $340,000 |
| Year 1 | $190,000 | All Tier 1 (safety-critical) | $150,000 |
| Year 2 | $95,000 | Majority of Tier 2 | $55,000 |
| Year 3 | $55,000 | Remaining Tier 2 + Tier 3 | $0 |
The figures here are a modeling example, not a universal formula — every fleet's actual numbers depend on its own inspection records, local labor and parts costs, and vehicle mix. What matters is the shape of the request: it asks for the largest amount in year one specifically to close Tier 1 risk, then tapers — which is a far easier line for a council to approve across three budget cycles than a single lump request with no explanation of sequencing. See how to build this glide path from your own fleet's live backlog data instead of a static spreadsheet model.
What a Finance Officer Actually Asks For
The quote below is close to how these conversations actually go once a backlog stops being a guess. Book a demo if you'd rather see the report format than read about it.
Every year the fleet division would ask for "more maintenance funding" and every year it competed with parks, roads, and everyone else's version of the same ask. Nobody could tell me what we'd actually get for the money.
The year they came in with a tiered list — dollar amount, what's safety-critical, what's not, and a three-year path to zero backlog — it was the easiest maintenance line I'd approved in a decade. I didn't fund it because the number was smaller. I funded it because I could finally see what I was buying.
Budget Request Documentation Checklist
Before a backlog costing report goes to finance, run it against this list. Every item here is something HVI pulls directly from inspection and work order records — no re-keying a spreadsheet from paper the night before a hearing.
Teams that build this list by hand from paper inspection sheets typically lose a week of prep time per budget cycle reconstructing it. Start a free trial and the next backlog report pulls itself from records your technicians are already logging in the field.
Frequently Asked Questions
How do you put a dollar figure on a government fleet's deferred maintenance backlog?
List every open deferred item with its age, assign it a labor-and-parts estimate, and sort it into a risk tier (safety-critical, operational, or routine). Summing those line items — rather than estimating a single round number — produces a figure finance can actually verify.
Does deferred maintenance always get more expensive the longer it waits?
In general, yes, though the rate varies by item. A $1-to-$4 or higher escalation ratio is widely cited in asset-management research, but it isn't a fixed multiplier for every repair — treat it as a directional signal, weighted more heavily for safety-critical items than routine ones.
What should a government fleet's budget request for deferred maintenance include?
A total figure broken into risk tiers, the age of the oldest open items, a comparison to the prior reporting period's total, and a multi-year plan to close the backlog — not a single lump sum with no supporting detail behind it.
How many years should a backlog reduction plan cover?
Most agencies use a two-to-three-year glide path: the first year funds safety-critical items, and remaining tiers are closed over the following cycles. The right length depends on backlog size and annual funding capacity, not a fixed rule.
Can maintenance software actually generate this costing report automatically?
Where inspection and work order data is logged consistently, a connected system like HVI can tag items by tier and age at the point of inspection and roll them into a report. The accuracy still depends on technicians logging items as they're found.
Turn your deferred maintenance backlog into a budget-ready report
A costed, tiered, trended backlog report doesn't have to be rebuilt from scratch every budget cycle. HVI captures age, priority, and cost estimate at the point of inspection, so the report that wins your next hearing is already waiting in the dashboard.
No credit card · Built for public-sector fleets · See your own backlog, tiered and costed