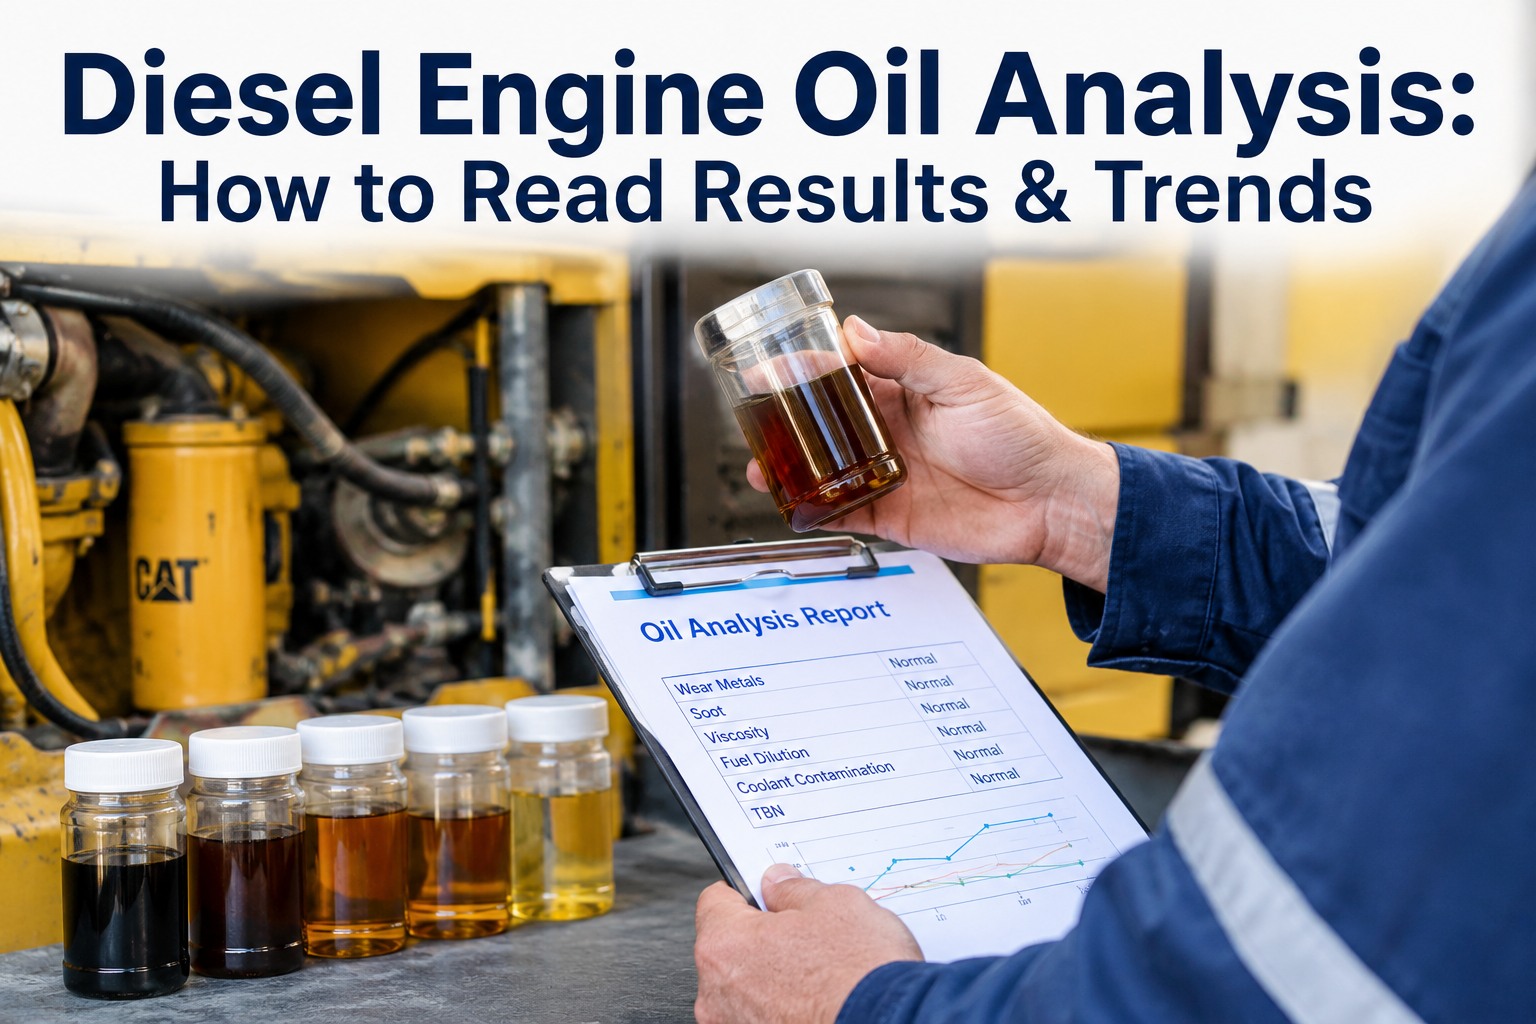
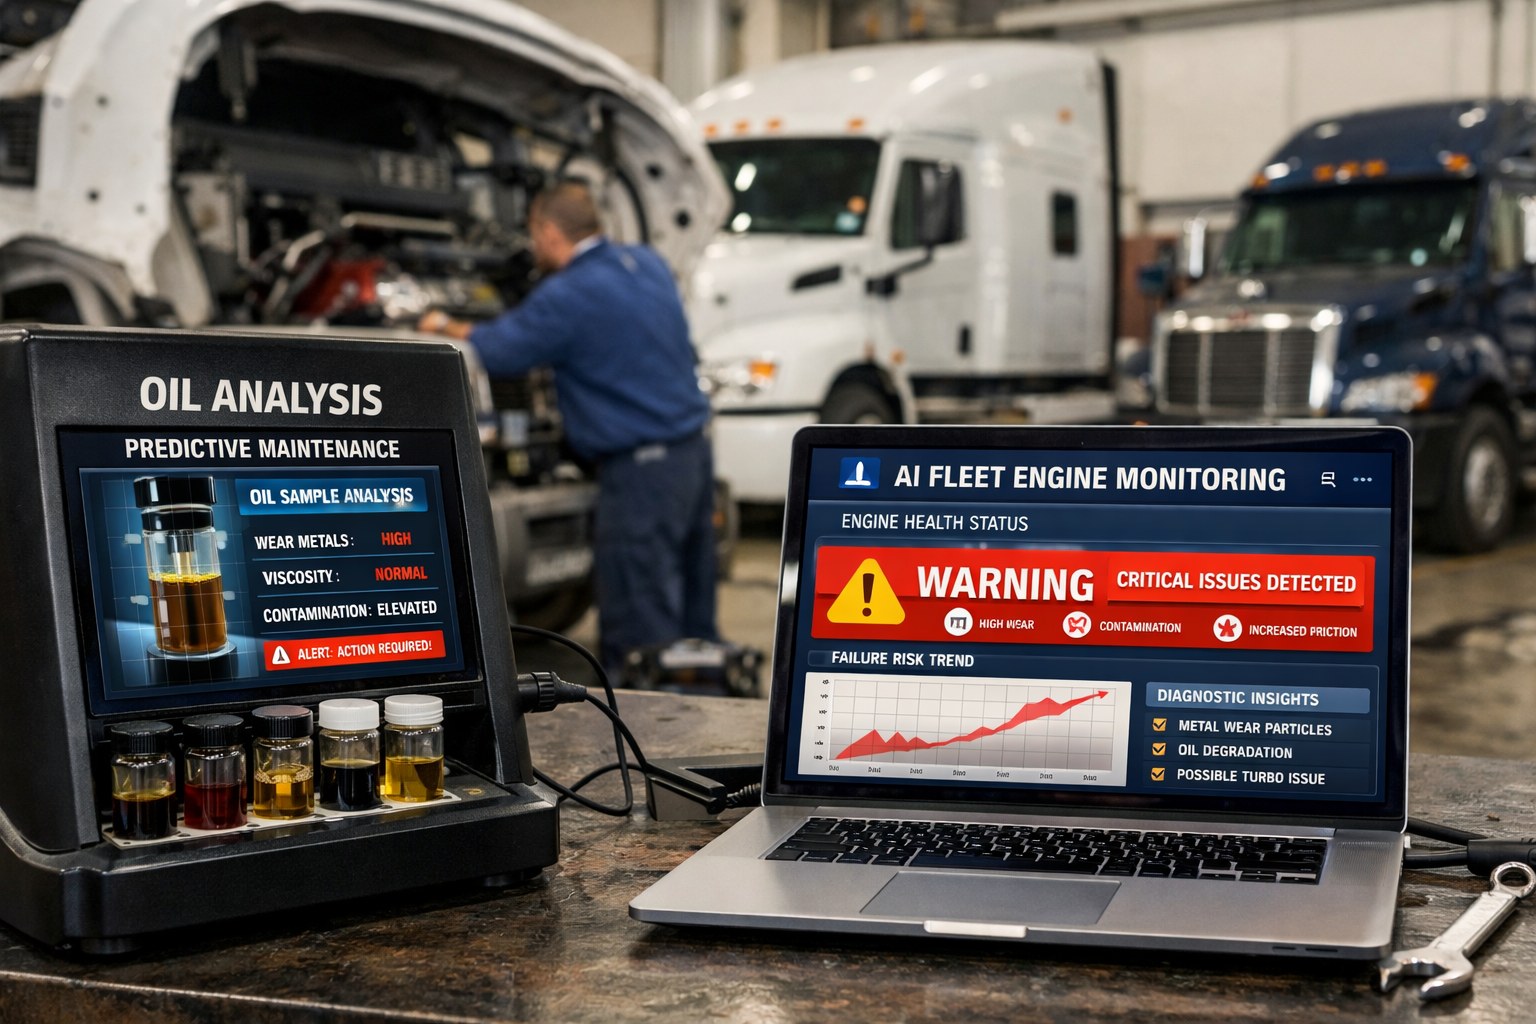
Diesel engine oil analysis turns a $20 lab sample into a 30-90-day early warning on component failure — but only if the report gets read as a trend, not as a single number. A 45 ppm iron result means one thing on its first sample and something entirely different when it's climbed from 15 to 45 over three intervals. This guide walks the wear metal fingerprints, oil-condition indicators (viscosity, TBN, soot, fuel dilution, coolant), and the reading rules — book a demo to track oil analysis trends in HVI.
Wear Metal Fingerprint — What Each Element Tells You
Every element on a diesel oil report traces to a specific engine component. Read the trend, cross-check the corroborators — and the failure signature is one column away from being obvious.
Each element on the report traces to a specific component. Each has a trend that matters more than the absolute number. Each corroborates or contradicts the elements next to it — that's how a real diagnosis gets made.
The rest of this page walks how to read oil-condition indicators (viscosity, TBN, soot, fuel dilution), the sampling discipline that makes trend data actually comparable, how to interpret patterns across parameters rather than chasing single numbers, and the change-in-trend rules that turn oil analysis into a 30-90-day early warning. Book a 30-minute demo to see per-asset oil trends captured in HVI.
Oil condition indicators — the second half of every oil report
Wear metals tell what's coming off the engine. Oil condition indicators tell whether the oil itself is still doing its job. On a well-run analysis programme both halves are read together at every sample — because a healthy oil with rising wear metals means the engine is wearing, while degraded oil with normal wear metals means the drain interval or duty cycle needs adjustment.
| Indicator | What healthy looks like | What a fault signature looks like |
|---|---|---|
| Viscosity @ 100°C (cSt) | Within ±10% of fresh oil spec | Rising → oxidation/soot/wrong top-up; falling → fuel dilution/coolant/wrong grade |
| TBN (Total Base Number) | Above 50% of fresh oil value; above 2.0 minimum | Drops below 50% or 2.0 → acid neutralisation reserve gone; change oil immediately |
| TAN (Total Acid Number) | Stable near fresh baseline | Rising → oxidation; varnish/sludge risk; corroborates viscosity rise |
| Soot loading (%) | Below 3% | Above 3% → dispersants overwhelmed, sludge forming, viscosity thickening |
| Fuel dilution (%) | Below 2% | Above 4% → injector/regen fault; even 2-4% drops 15W-40 to 30-weight |
| Water (%) | Below 0.1% (trace only) | Above 0.2% → coolant leak, condensation, or contamination; investigate |
| Oxidation (Abs/cm) | Stable, gradually rising with hours | Sharp rise → over-extended drain, high operating temp, or contamination |
| Glycol (positive/negative) | Negative — no glycol detected | Positive → coolant leak confirmed; stop engine, diagnose |
The condition indicators do more than tell drain-interval readiness. They corroborate wear-metal patterns and often identify the root cause before the wear signature does. Fuel dilution rising means unburned diesel is entering the crankcase, which points to injector or DPF regeneration issues — and the same underlying problem will start producing bearing wear (Pb, Cu) if left uncorrected. Every oil condition parameter is a warning signal for the next set of wear metal readings. Book a demo to see wear-metal and oil-condition trends together per asset in HVI.
Sampling discipline — the reason trend data is comparable (or isn't)
The single most common reason oil analysis programmes produce noisy, hard-to-interpret data is inconsistent sampling. Wear metal concentrations naturally vary by where in the pan the sample is taken, at what temperature, at what point in the oil's life, and using what container. Every meaningful trend depends on removing that noise, which means every sample from every asset should follow an identical procedure.
Sample hot & mid-stream
Take the sample while the oil is at operating temperature and mid-way through the drain — not the first oil out (concentrated debris) and not the last (settled sludge). Consistency of thermal state matters as much as consistency of technique.
Consistent interval & lab
Same sampling interval per asset (every oil change, or extended-drain sampling every 3,000-5,000 mi), same laboratory over time, same oil brand and viscosity grade. Switching labs mid-programme resets your baseline because different labs use different reference ranges.
Record duty cycle context
Every sample logged with the operating conditions since last sample: hours, miles, % idle, regen frequency, ambient temperature range, load profile. Wear metals rise faster on a truck idling 30% of engine hours than one that's mostly highway — and the comparison is meaningless without context.
Clean container, correct label
Certified sample bottles only — not shop containers, not rinsed jars. Cap seated immediately after sampling. Label with asset ID, sample date, engine hours, mileage, oil brand/grade, last change date. A mislabelled sample is a useless sample.
Sample cost is $15-25 per test at commercial labs. Sampling frequency: every oil change for standard drains, every 3,000-5,000 mi between changes for extended-drain programmes, quarterly for new engines after break-in. The total cost of a well-run oil analysis programme runs $100-300 per asset per year — and typically catches at least one bearing or injector failure per fleet per year that would have cost $15K-$45K to repair reactively. The ROI is not marginal. Book a demo to see oil analysis sampling schedules per asset in HVI.
Pattern reading — five common signatures and what they mean
Single elements rarely tell a diagnosis. Combinations of elements and oil-condition indicators produce signatures that map to specific failure modes. These five come up most often on diesel fleet oil analysis and each has a distinct corrective action.
Dirt ingestion
- Signature: Fe up + Cr up + Si up + viscosity slightly up
- Root cause: Air filter seal failure, intake leak, or dusty operating environment
- Action: Inspect air filter, seal condition, intake plumbing immediately
- Urgency: High — abrasive wear escalates fast
Coolant leak
- Signature: Na/K rising + water >0.2% + TAN rising + Cu rising
- Root cause: Head gasket, oil cooler, or liner seal failure
- Action: Stop the engine, pressure-test cooling system, inspect head gasket & cooler
- Urgency: Critical — glycol corrodes bearings fast
Fuel dilution
- Signature: Fuel >4% + viscosity dropping + soot may rise
- Root cause: Leaking injector, incomplete regen, extended idling
- Action: Diagnose injectors & regen cycle; shorten drain interval
- Urgency: Moderate — thin oil accelerates bearing wear
Bearing wear
- Signature: Pb rising + Cu rising + Sn may rise together
- Root cause: Bearing overlay wearing through; often lubrication issue
- Action: Investigate lubrication, oil pressure, filter condition; plan overhaul
- Urgency: High — bearing failure is catastrophic
Oil exhausted
- Signature: TBN <50% of fresh or below 2.0 + oxidation rising + viscosity thickening
- Root cause: Oil has run past its useful life; drain interval too long or duty too heavy
- Action: Change oil now; review drain interval against duty cycle
- Urgency: Moderate — acid corrosion damages surfaces
Normal wear (no action)
- Signature: All wear metals stable within ±20% of baseline; TBN >50%
- Root cause: Engine wearing normally at expected rate for its age & duty
- Action: Continue current maintenance; next sample at scheduled interval
- Note: This is the most common result on a well-run fleet
Reading a report as a pattern (not a set of individual numbers) is the difference between "we spend $20 per sample" and "we prevent one $30K catastrophic failure per year." A rising iron reading is a data point; a rising iron reading combined with rising silicon and rising viscosity is a diagnosis. Every lab report supports this analysis if the reader knows to run it. Start a free HVI trial to log oil analysis patterns per asset over time.
A reliability engineer on the coolant leak caught 8 weeks before catastrophic failure
I run reliability for a 92-truck long-haul fleet. We sample every oil change on every asset — standard programme, been in place four years. Sample cost is under $20, so cost of the whole programme is roughly $9,000/year across the fleet. Two years ago we caught a coolant leak on a 2019 Cascadia that would have taken the engine out.
Sample from truck 7241 came back with sodium at 18 ppm (baseline had been under 5), potassium at 6 (baseline under 2), water at 0.3%, TAN rising slightly, copper up from 12 to 34 ppm. Any one number looked marginal. All four together said coolant leak, and the copper rise told us the corrosion had started on the bearing surfaces. Pressure-tested the cooling system: hairline crack in the EGR cooler, exactly where you'd expect early failure.
Replaced the EGR cooler that week for about $2,800 parts and labour. If we'd waited for it to show up as low coolant or overheating warning we'd have been looking at a full engine overhaul at $28-35K. The four-parameter signature was the diagnosis. The single numbers weren't.
Frequently asked questions
How do I read a diesel engine oil analysis report?
Read the report as a trend, not a set of single numbers. Every lab report has three sections: wear metal spectroscopy (Fe, Cu, Pb, Al, Cr, Sn, Ni, Ti in parts-per-million), oil condition indicators (viscosity, TBN, TAN, soot, oxidation), and contamination screening (Si for dirt, Na/K for coolant, water, fuel, glycol). The correct reading sequence: first compare each value against the previous 2-3 samples on the same asset (rate of change matters more than absolute concentration); second check against the laboratory's alarm limits for your specific oil grade and engine type (lab limits are calibrated for your equipment, generic internet thresholds are not); third look for corroborating evidence across sections (high iron + high silicon + rising viscosity together point to dirt ingestion; high copper + water + elevated TAN together indicate coolant leak with bearing corrosion). Fourth cross-check against OEM recommendations for your specific engine (Cummins, Detroit Diesel, PACCAR, Volvo, etc. each publish specific wear-metal thresholds). Never diagnose from a single sample and never diagnose from a single element — both are how oil analysis produces false alarms and missed real problems. The correct interpretation is always trend + corroboration + duty-cycle context together.
What do wear metals in engine oil indicate?
Each wear metal traces to a specific engine component, which is what makes oil analysis a diagnostic tool rather than just a condition indicator. Iron comes from cylinder liners, gears, shafts, valve train, and housings — often the earliest wear indicator because most engine surfaces are ferrous. Copper originates from bearings, bushings, bronze parts, and the oil cooler, and often reads high early in engine life as it flushes from the oil cooler (evaluate by trend, not fixed limit). Lead is bearing overlay material and rising values specifically flag bearing wear (API CJ-4 spec limit 120 ppm max per ASTM D6594). Aluminum comes from pistons and housings, often combined with iron and chromium when piston-liner wear is developing. Chromium is piston ring plating and cylinder liner plating, often the earliest wear indicator when combined with iron. Tin is bearing overlay material similar to lead. Silicon is external contamination from dirt ingested through air filter failure or intake leaks, not a wear metal itself. Sodium and potassium point to coolant contamination (glycol leak into oil). Each element rising in isolation may be normal variance; multiple elements rising together in a recognisable pattern is a diagnosis. Trend over 2-3 consecutive samples on the same asset is always more meaningful than a single high number.
What is TBN in oil analysis and when should oil be changed?
TBN (Total Base Number) measures the alkaline reserve of the oil — its remaining capacity to neutralise the acidic byproducts of diesel combustion. Fresh diesel engine oil typically starts at TBN 8-12 depending on formulation and API service classification. As the oil operates, sulfur and nitrogen combustion products form acids that the TBN additives neutralise, gradually depleting the reserve. The industry rule of thumb: change oil when TBN drops to 50% of the fresh-oil value, or below an absolute minimum of 2.0 — whichever comes first. Some engine manufacturers publish more specific TBN limits for their engines. Once TBN falls below the threshold, unneutralised acids begin corroding engine internals (bearing surfaces first, then cam surfaces and cylinder walls), which shows up on subsequent samples as rising copper, lead, and iron. TBN tracking is what allows extended-drain programmes to be safe: rather than draining at a fixed mileage interval, sampling every 3,000-5,000 mi between changes and monitoring TBN allows extending drains until the oil actually reaches end-of-life — often 30-50% longer than conservative fixed intervals. TBN below 50% or 2.0 is a mandatory change signal regardless of remaining mileage on the drain schedule.
How much fuel dilution in diesel oil is acceptable?
Below 2% fuel dilution is generally acceptable and expected on any diesel operation. Between 2-4% warrants monitoring and root-cause investigation but is often not immediately actionable if trend is stable. Above 4% is a fault signature requiring diagnosis of injectors, DPF regeneration cycles, or extended idling patterns. Above 6% with viscosity dropped below 9 cSt (@ 100°C) is a definite fault requiring immediate corrective action per manufacturer guidance. The reason low thresholds matter: even 2-4% fuel dilution can drop the viscosity of a 15W-40 diesel oil down to a 30-weight or lower, which strips the protective film from the crankshaft and rod bearings and accelerates bearing wear. The wear does not always show up immediately on wear metal readings because the initial damage is polishing rather than material loss, but sustained fuel dilution >4% for multiple sample intervals produces measurable copper and lead increases within 2-3 samples. Common root causes: leaking injector nozzle (single-cylinder fault, look for one cylinder running lean), incomplete diesel particulate filter regeneration (regen cycles not completing, fuel dumped into exhaust runs down cylinder walls into crankcase), and extended idling with cold ambient temperatures. Corrective action: injector diagnostic, DPF regen review, idle-time reduction, and shortened drain interval while the fault is being resolved.
How often should diesel engine oil be sampled?
Sampling frequency depends on the objective of the programme. Standard condition monitoring: sample at every oil change (typically every 5,000-15,000 miles depending on duty class and OEM recommendation). This produces a baseline trend per asset and catches sudden problems without adding significant cost. Extended-drain programmes: sample every 3,000-5,000 miles between oil changes to prove the oil is still fit for continued service — TBN monitoring is what makes safe drain extension possible, and typically extends drain intervals 30-50% beyond conservative fixed schedules while catching any oil-condition or wear-metal warning that would end the extended run early. New engines: sample at break-in (typically 500-1,500 miles) to establish baseline wear metal levels, then quarterly for the first year while wear metals settle into a normal range. Engines with a suspected problem: sample more frequently until the trend clears — often every 500-2,000 miles — to confirm whether corrective action has resolved the issue. Sample cost at commercial labs is $15-25 per test. Total programme cost typically runs $100-300 per asset per year and catches at least one bearing, injector, coolant, or contamination failure per fleet per year that would have cost $15,000-$45,000 to repair reactively. Consistent sampling discipline (same interval, same lab, same procedure) is what makes the trend data meaningful.
Turn every $20 oil sample into a 30-90 day early warning.
HVI captures oil analysis results per asset per sample date, logs all wear metals and oil-condition indicators as structured fields, trends each parameter over time so patterns (Fe+Cr+Si dirt signature, Pb+Cu bearing signature, Na/K+water coolant signature) become visible at a glance, alerts on baseline deviation and lab limit breaches, and routes confirmed defects into corrective work orders. The PDF report from your lab becomes a live per-asset condition monitoring record. Live in under two weeks. No hardware. No credit card.
Trusted by fleets running condition-based maintenance across USA, Canada, UK & Australia · Ready on day one

.png)