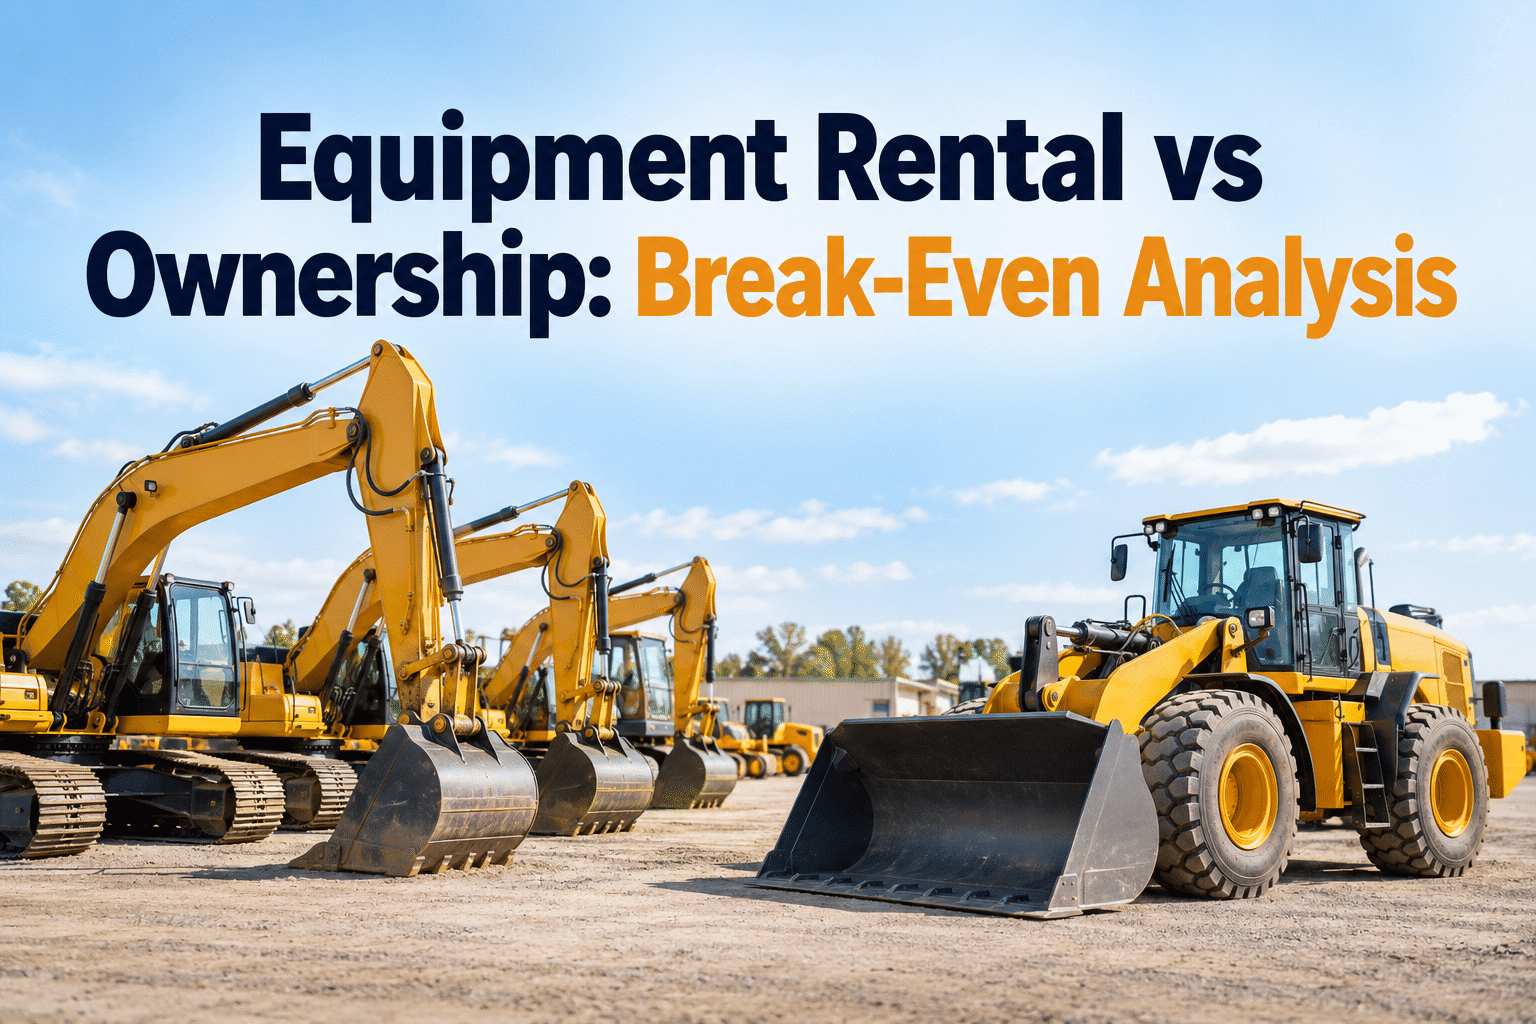
You're paying a rental invoice every month on a skid steer the crew swears they use "all the time" — and a voice says just buy it. The honest answer to equipment rental vs ownership isn't a gut call; it's one number: how many hours that machine actually turns in a year. Get it from memory and you'll own a unit that sits parked, or rent one you should have bought two seasons ago. Book a demo to see your real per-machine utilization first.
The Break-Even on Rent vs Own Is One Number You Probably Don't Track
Slide the dial. Watch where the scale tips from "rent it" to "own it" — and see why the number you're guessing is almost always wrong.
Fixed ownership costs spread over too few hours — you'd pay a full ownership rate on a machine that mostly sits.
Rent for now, but a rent-to-own deal can credit payments toward purchase if the hours keep climbing toward break-even.
Fixed costs now spread across enough hours that owning beats the rental rate per hour on the very same machine.
Every rental month here is pure markup on an asset you were always going to need. Owning is clearly cheaper.
That dial is the whole decision in miniature. The problem is that almost nobody feeds it real data. Below is the one tipping-point number that flips rent to own, the hidden costs that quietly move your break-even, a worked crossover on a single machine, and how to track the hours so the math is yours — not a guess.
60–65%the utilization band where ownership starts to win
Across construction and heavy-fleet guidance, the equipment rental vs ownership tipping point clusters in the same place: roughly 60 to 65 percent of available hours. On a standard ~2,000-hour working year, that's about 1,200 to 1,300 operating hours, or near 150 working days. Below the band, renting almost always wins. Above it, the per-hour cost of owning drops under what the same hours would cost to rent.
Your own break-even shifts with machine class, resale strength and cost of capital — these bands are the starting map, not a fixed line.
Here's the catch the bands don't show: utilization is seasonal. A northern paving contractor loses months of available hours to winter, so a machine that looks flat-out all summer can still finish the year well under the ownership band. One busy quarter feels like "we use it constantly" — the annual number tells a different story. That gap between the feeling and the figure is exactly where owners buy wrong. Book a demo to see per-machine hours trended across the full year, not just the busy stretch.
The hidden stackwhy your "ownership cost" is lower than reality
Most owners compare the rental invoice to the loan payment and stop there. That's the mistake that quietly breaks the whole analysis. The monthly note is only the visible tip of ownership cost — the real number is a stack of fixed and variable costs that most fleets never roll into a single per-hour rate.
Fold all of that in and your true ownership cost per hour depends entirely on the denominator — hours. Spread $30,000 of annual fixed cost over 1,200 hours and you're at $25/hour; run the same machine only 600 hours and it doubles to $50/hour. Same truck, same costs, double the per-hour price, purely because it sat. Tracking those real figures is what HVI's cost-per-hour and expense analysis is built to do, pulling parts, labor, fuel and PO costs into one per-asset rate instead of a spreadsheet you update once a quarter. Book a demo of the fully-loaded cost-per-hour view to see the hidden stack on your own machines.
The crossoverone machine, rent column vs own column
The cleanest way to settle rent vs buy on a specific unit is to put annual rental spend next to fully-loaded annual ownership cost for the same machine and the same hours. Here's a worked example on a skid steer a contractor expects to need about eight months a year — rounded, illustrative figures to show the method, not a quote.
Rent it
- Monthly rate~$3,500
- Months needed8
- Base rental$28,000
- Damage waiver / deliveryadd-on
Own it
- Finance / depreciationbuilt in
- Maintenance + insurancebuilt in
- Storage + capitalbuilt in
- Fully-loaded annual~$19,900
Notice what decides it: not the sticker price, not the monthly rate in isolation, but hours against fully-loaded cost. That's the same logic behind right-sizing a whole yard — deciding which machines to keep, sell or convert from rental based on what each one actually earns its keep at. HVI's asset management tools hold those per-machine hours and costs in one place. Sign up free and start logging real engine hours so your next crossover is built on your numbers.
Where the number comes fromasset utilization, captured not guessed
Every guide on this topic lands on the same quiet admission: most contractors estimate utilization from memory. That's the weak link. HVI closes it by turning engine hours, usage days and per-asset cost into live data you can actually read off a screen before a purchase decision.
Pull real runtime from GPS & telematics and OEM telematics feeds — no clipboard estimate of how busy a machine "felt."
Operator daily reporting logs meter readings, runtime and downtime per shift, so seasonal gaps show up in the annual number.
Parts, labor, fuel and PO spend roll into one per-asset rate in analytics & reporting — the honest denominator for break-even.
Asset management flags units running well under break-even for two seasons — the ones to auction or convert from rental.
Three ways to play itrent, own, or the middle path most owners skip
Rent-vs-own isn't binary. The best-run fleets match the ownership model to the role each machine plays — core workhorse, seasonal spike, or specialized one-off. Here's how the three options break down once you know a machine's real utilization.
Rent
For machines under the break-even band, specialized attachments used a few times a year, or a one-season-only need. You pay a premium per hour but dodge depreciation, storage and a parked asset.
- No capital tied up
- Maintenance is the rental company's problem
- Right for standby and spike demand
Hybrid / RPO
A rental-purchase option credits part of your rental payments toward the buy price if you convert. Ideal when a machine is creeping up through the grey 40–60% zone and you're not sure yet.
- Try before you commit capital
- Payments aren't fully sunk
- Convert when hours clear break-even
Own
For core machines above the band that appear on nearly every job. Owning removes the rental markup you'd otherwise pay every month on a unit you were always going to need.
- Lowest cost per hour at high utilization
- Availability on demand, no booking
- Possible tax treatment on purchase
The thread through all three is the same: you can only assign a machine to the right bucket once you know its real hours and real cost. Run that review for your whole yard and the rent-vs-own decisions stop being arguments and start being obvious. It's the same per-asset discipline behind HVI for construction fleets. Book a demo to bucket your own yard into rent, own and hybrid in one session.
From a fleet manager who ran the review
We'd been renting a loader for three summers straight because it "felt occasional." When we finally pulled the actual engine hours, it was running 71% of available time — well past the point where owning is cheaper. We'd handed the rental company close to the purchase price in markup. Now I don't argue rent-vs-own in a meeting; I open the utilization screen and the number decides it.
Equipment rental vs ownership — FAQs
What utilization rate makes buying heavy equipment worth it?
The widely used tipping point is roughly 60–65% utilization — about 1,200–1,300 hours on a standard 2,000-hour year, or near 150 working days. Above that, owning usually costs less per hour than renting the same class. Your exact break-even shifts with machine type, resale value and cost of capital.
How do I calculate equipment utilization rate?
Divide the hours a machine actually operated by the total hours it was available — typically around 2,000 for a full working year. A unit that ran 800 of those hours sits at 40% utilization. HVI captures the operated-hours figure automatically from telematics and operator reports, so the number isn't a guess.
What costs beyond the purchase price go into ownership?
The loan payment is just the start. Add depreciation (often 20–30% in year one), insurance (~1–3% of value yearly), maintenance and repair (~5–10% of purchase price), storage, transport, idle time and cost of capital. Fold all of it in before comparing to a rental rate, or the math favors ownership falsely.
Does HVI tell me whether to rent or buy?
HVI doesn't make the call for you, but it supplies the two numbers the call depends on: real per-machine engine hours and fully-loaded cost per hour. With accurate utilization and cost on screen, you apply the break-even band yourself with confidence instead of estimating from a busy season.
What is a rental-purchase option (RPO)?
An RPO is a rental agreement, signed before the rental starts, that credits a share of your payments toward the purchase price if you later convert to ownership. It's the hybrid path for a machine climbing through the uncertain 40–60% band — you keep flexibility without fully sinking the rental spend.
Make your rent-vs-own call on your own hours, not a hunch
HVI tracks engine hours, usage days and true cost per hour for every machine in your yard, flags the units sitting under break-even, and turns rent-vs-own into a number you can read in seconds. Live on your fleet in under two weeks.
No credit card · No hardware · Asset utilization ready on day one