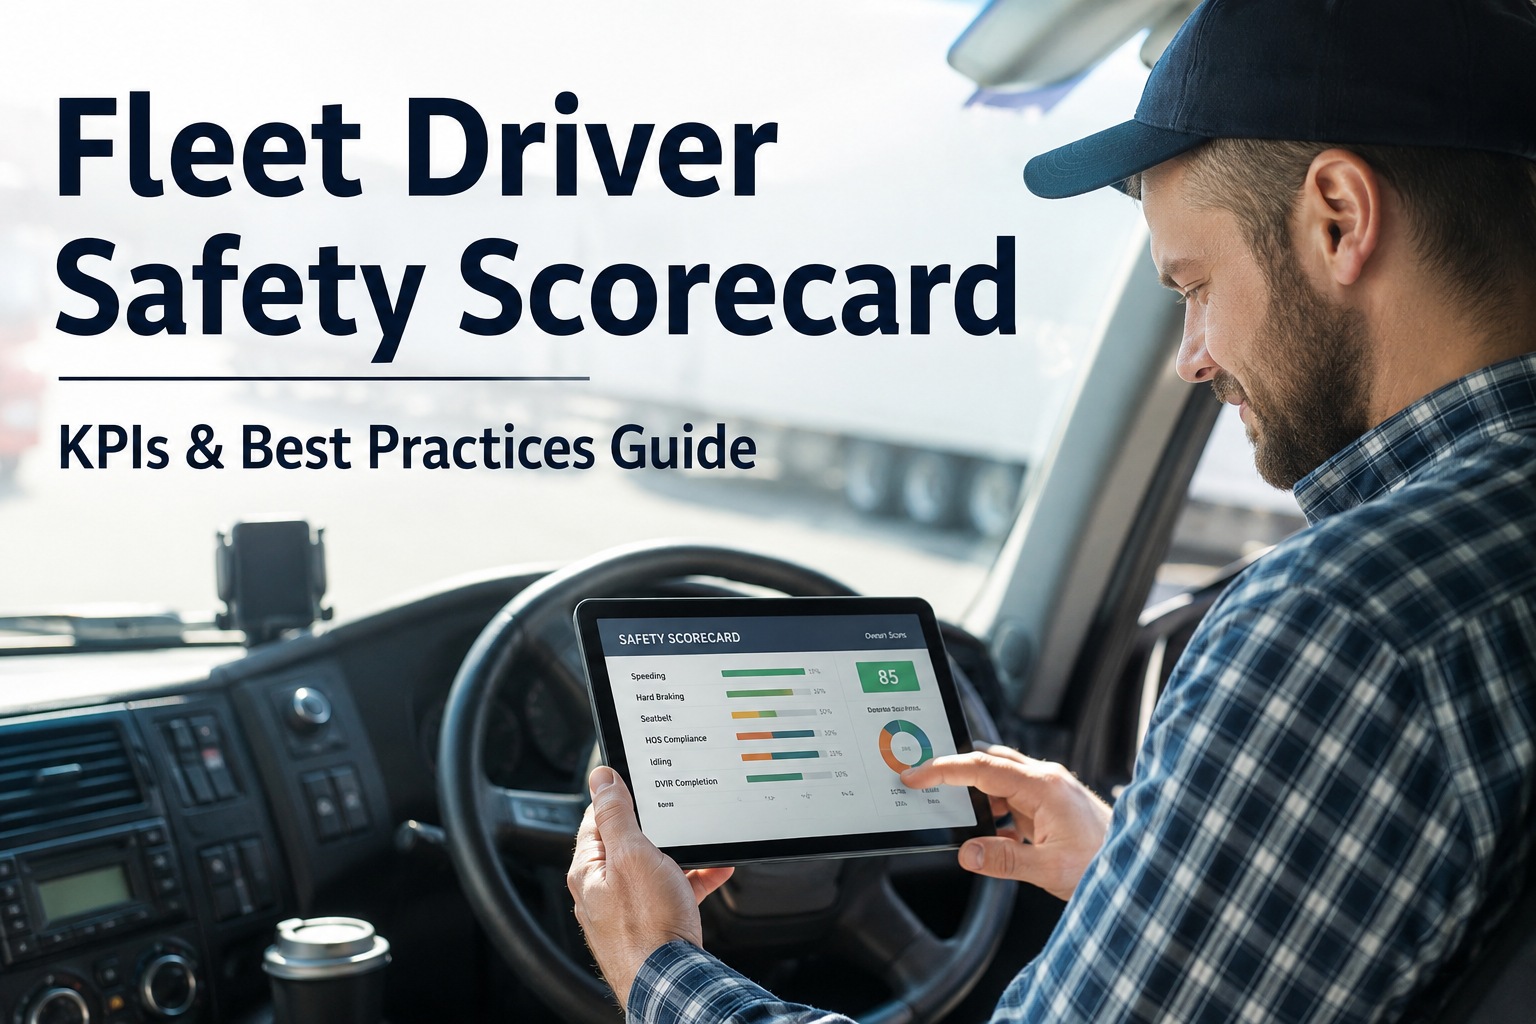
A driver safety scorecard is where fleet-level safety data becomes individually actionable. Every telematics platform captures speeding, harsh braking, HOS violations, and idle time by driver — but data alone doesn't change behavior. The scorecard is what turns that raw data into a ranked leaderboard, a coaching queue, and a performance conversation your safety manager can actually have with a specific driver on a specific Tuesday morning. Done well, a scorecard cuts preventable incident rate by 30–50% within two quarters, and drives insurance premium negotiations that pay for the entire compliance software stack. Done poorly, it becomes a spreadsheet nobody looks at and a punitive ranking that erodes driver retention. This guide walks through the exact KPIs that belong on a driver safety scorecard, how to weight them for your fleet's freight profile, the 5-tier ranking system that best-in-class fleets use, and the coaching cycle that turns rankings into behavior change. Book a demo when you want to see the live scorecard on your DOT number.
What a working scorecard actually looks like
Individual driver · overall score · ranked tier · weighted KPI breakdown · coaching flag
The 8 KPIs every driver safety scorecard needs
Not every metric belongs on a scorecard — too many and the coaching signal gets buried in noise. These eight KPIs, organized into three categories, cover 90%+ of what actually correlates with preventable incident rate and CSA percentile impact.
Safety Behaviors
Typical weight: 40–60%Compliance & Discipline
Typical weight: 25–35%Operational Efficiency
Typical weight: 15–25%Not on this list: total miles driven (rewards volume over safety), hours worked (rewards fatigue), or self-reported metrics of any kind. The scorecard should reward behaviors that reduce incident risk and compliance exposure — nothing else. Book a demo to see how these 8 KPIs map to your telematics feed
How to weight the KPIs for your fleet profile
Different fleets need different weightings. A hazmat carrier weights safety behaviors heavier than a dedicated fleet running low-value freight on repeat lanes. Here are the three most common weighting profiles — pick the one that matches your operation, or blend two.
Safety-first
LTL · hazmat · tanker · passengerRight when incident cost dwarfs fuel cost. Common in insurance-sensitive operations.
Balanced
General TL · regional · dry van · refrigeratedDefault starting point. Adjustable up or down based on incident data.
Efficiency-focused
Dedicated lanes · short haul · local deliveryFits fleets where fuel is 30%+ of operating cost and safety events are rare.
The 5-tier ranking system
Once each driver has a weighted score from 0 to 100, tier assignment turns the number into an action. Every tier gets a different management response — recognition, minor coaching, formal plan, or intervention. Here's the ladder best-in-class fleets use.
The tier system works because it takes a continuous number (0-100 score) and turns it into a discrete action (recognition, coaching, plan, or intervention). That's what makes the scorecard operational rather than analytical. Book a demo to see the tier system running on real driver data
The coaching cycle: what happens after the scorecard runs
A scorecard without a coaching cycle is a spreadsheet. The five-step loop below is what turns the ranking into behavior change — and what separates fleets that see 5% improvement from ones that see 40%.
The cycle should be weekly, not monthly. Monthly is too infrequent for feedback loops to close — drivers forget the specific incidents, coaching becomes generic, and the whole system feels bureaucratic. Weekly keeps the conversation grounded in real events. Start a free trial to see the auto-populated coaching queue built into HVI.
Common scorecard mistakes to avoid
Most first-attempt driver scorecards fail for the same reasons. Here are the six most common mistakes — and what best-in-class fleets do instead.
Publish a full driver-by-driver leaderboard for the whole fleet to see.
Share tier bands (Elite / A / B) but keep individual scores private. Recognition public, coaching private.
Tie the scorecard directly to disciplinary action or termination on a rolling basis.
Use it as a coaching signal. Formal HR action only comes from documented failure of a written improvement plan.
Include 15+ KPIs to make it "comprehensive."
Limit to 6–10 KPIs. More metrics dilute the signal and make coaching conversations unfocused.
Weight all KPIs equally.
Weight based on your fleet profile. Safety behaviors typically 40–60%. Efficiency KPIs should never outweigh safety.
Only look at scores at month-end or quarter-end.
Refresh weekly. Coaching within 5–7 days of an event is 3× more effective than coaching 30 days later.
Compare drivers on incompatible routes as if they're peers.
Group by route type (long-haul, regional, local) so peer comparisons are fair. Idle time isn't the same metric for a P&D driver as an OTR driver.
Every one of these mistakes shows up in first-attempt scorecard rollouts — avoiding them at the start saves months of correcting course later. Start a free trial with pre-configured scorecard templates that already account for these pitfalls.
Driver scorecard ROI: what the numbers actually look like
The scorecard's economic case rests on three cost buckets that behavior change moves. Below is the typical impact profile for a 50-driver fleet running a weighted scorecard consistently over 12 months.
Direct outcome of behavior change in the top three safety KPIs (speeding, harsh braking, distracted driving). Insurance carriers now specifically underwrite fleets running structured scorecard programs at more favorable rates.
Efficiency KPIs (idle time, MPG) improve as drivers see their number weekly. On a 50-truck fleet, this typically translates to $180,000–$300,000 annual fuel recovery.
Counterintuitive but consistent: fleets running structured scorecard + coaching programs retain drivers better than fleets without them. Drivers value the feedback loop and the fairness of tier-based recognition.
Combined, these three impacts typically pay for the full compliance and telematics software stack inside 90 days on a mid-sized fleet, with everything after that flowing to the bottom line. Book a demo to see the ROI modeled on your fleet size
From a safety director who rolled out a scorecard on 84 drivers
We had all the telematics data. Speeding events, harsh braking, HOS violations, dash cam clips — everything. What we didn't have was any way to turn it into a conversation. My safety manager would email drivers when something bad happened, they'd get defensive, nothing changed.
The scorecard was the missing piece. Weekly refresh, five tiers, coaching queue auto-populated. First quarter our preventable incident rate dropped 38%. Fuel came in 11% lower than the same quarter prior year on similar mileage. And driver turnover actually went down — the guys in the top two tiers felt seen, and the guys in the bottom two felt the coaching was fair because it was specific.
The bottom line on driver safety scorecards
A driver safety scorecard is not a punitive ranking system — it's the operational bridge between the data your telematics already captures and the behavior change your safety program is trying to produce. Eight KPIs across three categories, weighted for your fleet profile, refreshed weekly, and mapped to a five-tier ranking with a coaching action per tier. The scorecard turns hundreds of raw events per driver per month into one score, one tier, one conversation. Fleets that run it consistently see 30–50% reductions in preventable incidents, 8–15% fuel spend improvements, and measurable driver retention gains inside a year. The software cost is typically recovered in the first insurance renewal cycle. Driver scorecards are the highest-leverage tool a safety manager has — not because they change what drivers know, but because they change what drivers pay attention to.
Frequently asked questions
What KPIs should a driver safety scorecard include?
A well-designed driver safety scorecard includes 6 to 10 KPIs organized into three categories. Safety Behaviors (typically weighted 40–60% of the total score): speeding events per 1,000 miles, harsh braking events, harsh acceleration events. Compliance & Discipline (25–35%): HOS compliance rate, seat belt usage percentage, distracted driving events flagged by dash cam AI. Operational Efficiency (15–25%): idle time percentage, fuel efficiency versus peer group baseline. Avoid metrics that reward volume over safety (total miles, hours worked), self-reported metrics, or KPIs that can't be pulled automatically from telematics/ELD/DVIR data. The right eight metrics correlate directly with preventable incident rate, CSA percentile impact, and operational cost — anything outside those three categories dilutes the signal. Adjust the specific mix based on your fleet's freight profile: hazmat and LTL carriers weight safety behaviors heavier, dedicated fleets on repeat lanes can weight efficiency slightly higher.
How often should a driver safety scorecard be refreshed?
Weekly. Monthly or quarterly refresh cycles are the single most common reason scorecard programs fail to change behavior. When coaching happens 30 days after an event, drivers have forgotten the specific incident, the feedback feels generic, and the whole conversation becomes bureaucratic. Weekly refresh means the coaching conversation is grounded in specific incidents from the last few days — a harsh braking event on Tuesday afternoon, a speeding event on Wednesday morning — which drivers can actually remember and respond to. Research consistently shows that coaching delivered within 5–7 days of an event is roughly 3 times more effective at changing behavior than coaching delivered 30+ days later. The scorecard itself can be viewable by drivers in real time (many best-in-class fleets do this via a mobile app), but the formal coaching conversation should happen weekly on a fixed cadence — ideally the same day of the week so drivers know when the conversation is coming and can prepare mentally.
Should driver scorecard rankings be public?
Partially, and with caveats. Full driver-by-driver leaderboards that publish individual scores for the entire fleet to see almost always backfire. Bottom-tier drivers become disengaged and defensive rather than motivated, top-tier drivers face resentment, and the culture shifts toward gaming metrics rather than improving behavior. The best practice is to publish tier bands only — "these five drivers are in Elite tier this month" — without exposing the actual scores or the tier assignments of lower performers. Recognition public, coaching private. Elite and A-tier drivers can be publicly recognized in monthly all-hands communications, safety meetings, and driver newsletters. B, C, and Needs-coaching tier drivers have their scores discussed one-on-one with the safety manager in confidential coaching sessions. Some fleets take a middle path with a mobile app where each driver can see their own score and where they rank in their tier band without seeing individual scores of other drivers. That balances transparency for motivation with privacy for coaching.
How does a driver scorecard affect CSA scores?
Indirectly, but powerfully. The scorecard doesn't feed CSA directly — CSA is calculated from roadside inspection results and crash data. But the KPIs on the scorecard are exactly the behaviors that generate roadside violations and crashes. Speeding on the scorecard becomes Unsafe Driving BASIC violations at roadside. Harsh braking correlates with following-distance issues and preventable crashes on the Crash Indicator BASIC. HOS compliance on the scorecard directly reduces HOS Compliance BASIC violations. Seat belt usage generates specific FMCSA violations when caught. Fleets that run structured scorecards typically see 10–25 percentile reductions in their Unsafe Driving BASIC within one year, 15–30 percentile reductions in HOS Compliance, and measurable improvements in Crash Indicator over the trailing 24 months as preventable crashes decline. The scorecard is the behavioral upstream of CSA scoring — you can't sustainably improve CSA without changing driver behavior, and the scorecard is how you systematically change driver behavior.
What is a good target score for a driver safety scorecard?
The exact target depends on your scoring methodology, but under the standard 0-100 weighted-average model, best-in-class fleets aim for a fleet-average score of 82–88 and a bottom-tier threshold above 65. In tier terms, the goal distribution looks roughly like this: 5–10% of drivers in Elite (90–100), 30–40% in A tier (80–89), 40–50% in B tier (70–79), 5–10% in C tier (60–69), and less than 3% in Needs Coaching (below 60). A healthy fleet has a normal distribution with a slight left skew — most drivers meeting or exceeding standards, a small tail requiring intervention. If your fleet's distribution shows more than 15% in C or Needs Coaching tiers, the issue is usually systemic (unrealistic KPI thresholds, unfair peer grouping, or missing training) rather than driver-specific. Adjust the scoring methodology before running punitive interventions. The target score should also trend upward over time as coaching improves — a static average score suggests the coaching cycle isn't closing.
Turn your telematics data into a driver behavior change engine
HVI ships with a pre-built driver safety scorecard: 8 KPIs across 3 categories, weighting profiles tuned to your fleet type, automatic 5-tier ranking, weekly refresh, and a coaching queue that surfaces the drivers who need attention this week. Live in under two weeks — typical fleets see preventable incident rate drop 25–40% inside a quarter.
No credit card · Works with any ELD, dash cam, and telematics provider