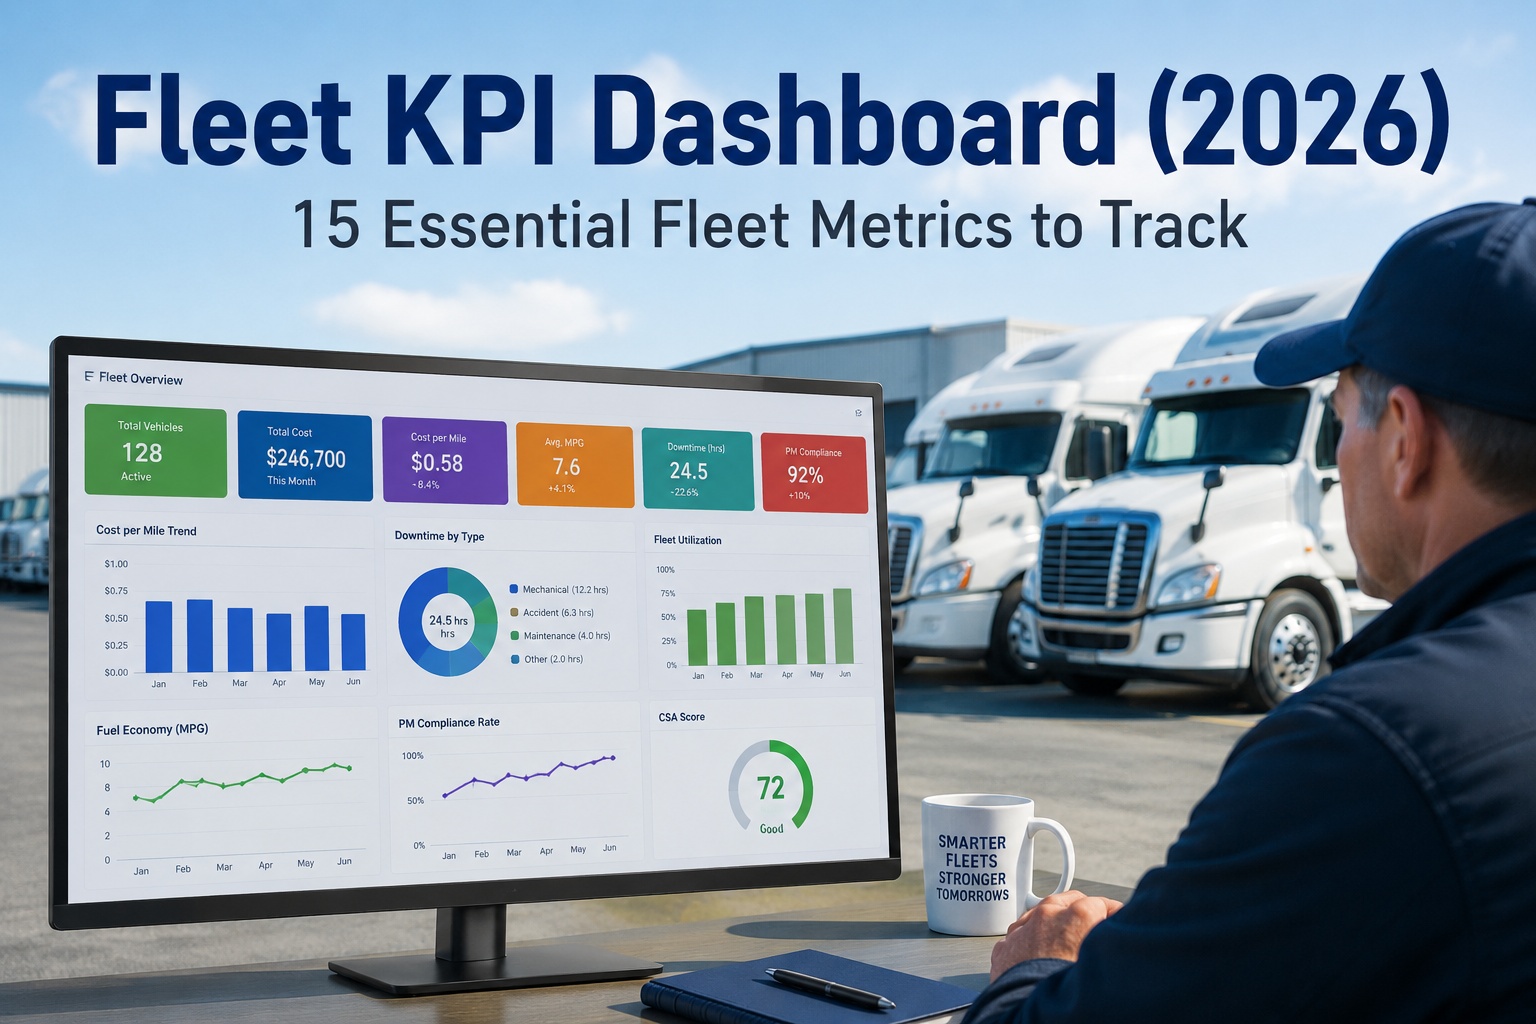
A fleet KPI dashboard is the single highest-leverage tool a fleet manager owns, but most operations track dozens of reports and act on only three or four numbers. The rest is noise. This guide covers the 15 fleet performance metrics that actually move profitability — organized into three categories, each with a formula, benchmark, and business impact you can act on this week. Skip the vanity metrics and build the dashboard your CFO wants to see. Book an HVI demo → for the pre-built version.
The dashboard your fleet actually needs — not the 40-report binder you're pretending to read.
Fleets that outperform their peers track a specific set of KPIs across three categories. Here's what a working dashboard looks like — and the 15 numbers that determine whether a fleet is profitable, safe, and audit-ready.
across 3 categories
a live dashboard
KPI-driven operations
Why 15 KPIs — and why these 15
Most fleets fail at KPI discipline in one of two directions. Either they track too little (three or four cost numbers and hope everything else takes care of itself) or they track too much (a monthly report with forty metrics that nobody reads past page two). The answer sits in the middle: fifteen KPIs, organized into three functional categories, each answering a question that leadership actually asks.
Every one of the fifteen has a formula that can be calculated from data the fleet already generates, a benchmark to measure against, and a specific action you can take when the number drifts. The dashboard doesn't need to be pretty; it needs to be accurate, current, and used. Book an HVI demo to see the pre-built version working on a live fleet.
Category 1 — Cost & Financial KPIs (5)
The financial layer is where the CFO conversation happens. These five metrics tell you whether the fleet is making money, losing money, or hiding money in places nobody's looking.
Cost Per Mile is the master metric because it rolls up almost everything else. If CPM is trending up while miles are flat, the fleet has a cost-side problem — usually maintenance or fuel. If CPM is flat but revenue miles are dropping, the fleet has a utilization problem. Reading CPM in isolation is meaningless; reading it against fuel economy, maintenance cost per mile, and utilization tells you exactly which lever to pull. Try HVI free to see per-truck CPM breakdown across your fleet.
Category 2 — Maintenance & Uptime KPIs (5)
The maintenance layer is where the fleet manager's day happens. These five KPIs surface the difference between reactive shops (breakdowns dictate the schedule) and disciplined shops (schedule dictates the breakdowns).
PM Compliance Rate is the leading indicator; Vehicle Uptime % is the lagging one. A fleet running 96% PM compliance and 89% uptime has a specific problem — either the PM plan isn't catching the actual failure modes, or the shop is losing time on non-PM work orders. The two numbers only make sense together. Book an HVI demo to see PM compliance trended against uptime for every unit.
Category 3 — Safety, Compliance & Utilization KPIs (5)
The safety and utilization layer is where insurance premiums, contract eligibility, and regulatory exposure get decided. These five KPIs are watched by underwriters, shippers, and DOT investigators — often before the fleet even knows they're being watched.
Fleet Utilization % is the metric most operations underestimate. A fleet running 68% utilization has effectively 32% of its capital sitting idle — and every idle truck still costs insurance, registration, and depreciation. Cutting the fleet by 10% to reach 82% utilization typically saves more per year than any fuel program can. Book an HVI demo to see per-truck utilization heatmaps.
Turning 15 KPIs into three decisions leadership actually makes
The KPIs are the input. The three decisions are the output. Every leadership meeting on fleet performance eventually resolves into one of these three — and the dashboard's job is to make each one obvious.
A dashboard that doesn't drive one of these three decisions is just a report. And a report nobody acts on isn't a KPI system — it's overhead. The point of the fifteen numbers is to consistently produce action, not to consistently produce printouts. Try HVI free to build the dashboard that drives decisions instead of paperwork.
From a fleet director running 68 tractors on national LTL routes
We had reports coming out of five different systems — telematics for miles and idle, a spreadsheet for maintenance, the accounting system for fuel cost, and the safety manager's binder for CSA. Every Monday I spent three hours assembling numbers into one deck for the operations meeting. Nobody read the deck.
Moved everything into HVI's KPI dashboard in Q2 2024. Within six months we identified 11 underused tractors we could pull out of service. Cost per mile dropped from $2.51 to $2.28. Vehicle Maintenance BASIC improved 23 percentile points because PM compliance became visible. The Monday deck now takes ten minutes and people actually make decisions from it.
TRTom R.Fleet Director · National LTL carrier · 68 Peterbilt + Kenworth tractors
Frequently asked questions
What is a fleet KPI dashboard?
A fleet KPI dashboard is a single-screen visualization of the key performance indicators that determine fleet profitability, uptime, and compliance. Instead of a dozen separate reports pulled from different systems, a dashboard consolidates cost, maintenance, safety, and utilization metrics into a live view that updates automatically as inspections, work orders, meter readings, and fuel logs are recorded. The point isn't to look at more numbers — it's to look at fewer, better-organized numbers that consistently produce action. Modern fleet dashboards cover roughly 15 essential KPIs across three categories: cost/financial, maintenance/uptime, and safety/compliance/utilization. Everything else is either derived from these 15 or is noise.
What is the most important fleet KPI?
Cost Per Mile (CPM) is the master fleet KPI because it rolls up almost every other operational input — fuel, maintenance, labor, insurance, depreciation — divided by revenue-generating miles. For most on-highway fleets in 2026 the benchmark sits between $2.20 and $2.60 per mile. CPM is only useful in context though: read it against fuel economy (isolates fuel cost), maintenance cost per mile (isolates PM performance), and fleet utilization (isolates capacity efficiency). PM Compliance Rate is the second most important KPI because it's the leading indicator that predicts where CPM is headed. A fleet at 96% PM compliance with $2.28 CPM this quarter is generally headed to a lower CPM next quarter; the opposite pattern predicts the opposite outcome.
How do you measure fleet utilization?
Fleet utilization percentage measures how much of your available vehicle capacity is actually generating revenue. Formula: active vehicle-hours divided by total available vehicle-hours (calculated over the same time window), multiplied by 100. Benchmark for well-run for-hire fleets sits at 85% or higher. Vocational and PTO-heavy operations often run lower legitimate utilization because equipment idle at a site is still contributing to a job. Utilization below 70% almost always signals fleet oversizing — you're paying insurance, depreciation, registration, and parking on capital that isn't generating margin. Miles Per Vehicle Per Month is a related but coarser measure; utilization percentage is the more actionable version. Fleets that cut units to reach 80%+ utilization consistently outperform peers who kept underused equipment on the books.
What is a good PM compliance rate for a fleet?
PM Compliance Rate benchmarks: 92% is the minimum for a disciplined operation, 96-98% is best-in-class, and anything below 85% indicates a reactive shop where breakdowns are driving the schedule instead of the schedule driving predictable maintenance. The formula is preventive maintenances completed on time divided by preventive maintenances due, over the reporting period. "On time" typically means within a 10% grace window of the scheduled interval (miles, hours, or calendar days). PM Compliance is the single most important leading indicator on a fleet dashboard because it predicts future uptime, future maintenance cost per mile, future Vehicle Maintenance BASIC scores, and indirectly future insurance renewals. Fleets that consistently hit 96%+ PM compliance almost always show better numbers across every other KPI within 6-12 months.
How often should fleet KPIs be reviewed?
Fleet KPIs get reviewed at three different cadences by three different audiences. Daily: PM Compliance Rate, DVIR Completion Rate, and any BASIC score movement — these are the shift-level operational metrics that surface problems while they're still cheap to fix. Weekly: Cost Per Mile trend, Vehicle Uptime %, First-Time Fix Rate, unplanned downtime cost — these are the management-level metrics that drive the Monday operations meeting. Monthly and quarterly: Total Cost of Ownership, Fleet Utilization %, MTBF trends, insurance-relevant safety data — these are the leadership-level metrics that drive capital decisions (which truck to sell, which shop to expand, which technology to invest in). A dashboard that surfaces all fifteen KPIs at the same time on the same page for every audience is a dashboard nobody reads. Segmentation by cadence and role is what makes it work.
Build the fleet KPI dashboard your CFO wants to see — without the spreadsheet build.
HVI's pre-built fleet KPI dashboard covers all 15 essential metrics with automatic data capture from inspections, work orders, meter readings, and fuel logs. Per-truck drilldowns for every metric. Executive summary view for leadership. Daily, weekly, and monthly cadences segmented by role. Live for your fleet in 5-7 days.
Cost per mile · PM compliance · Vehicle uptime · CSA trend · Utilization · SOC 2 Type II

.png)