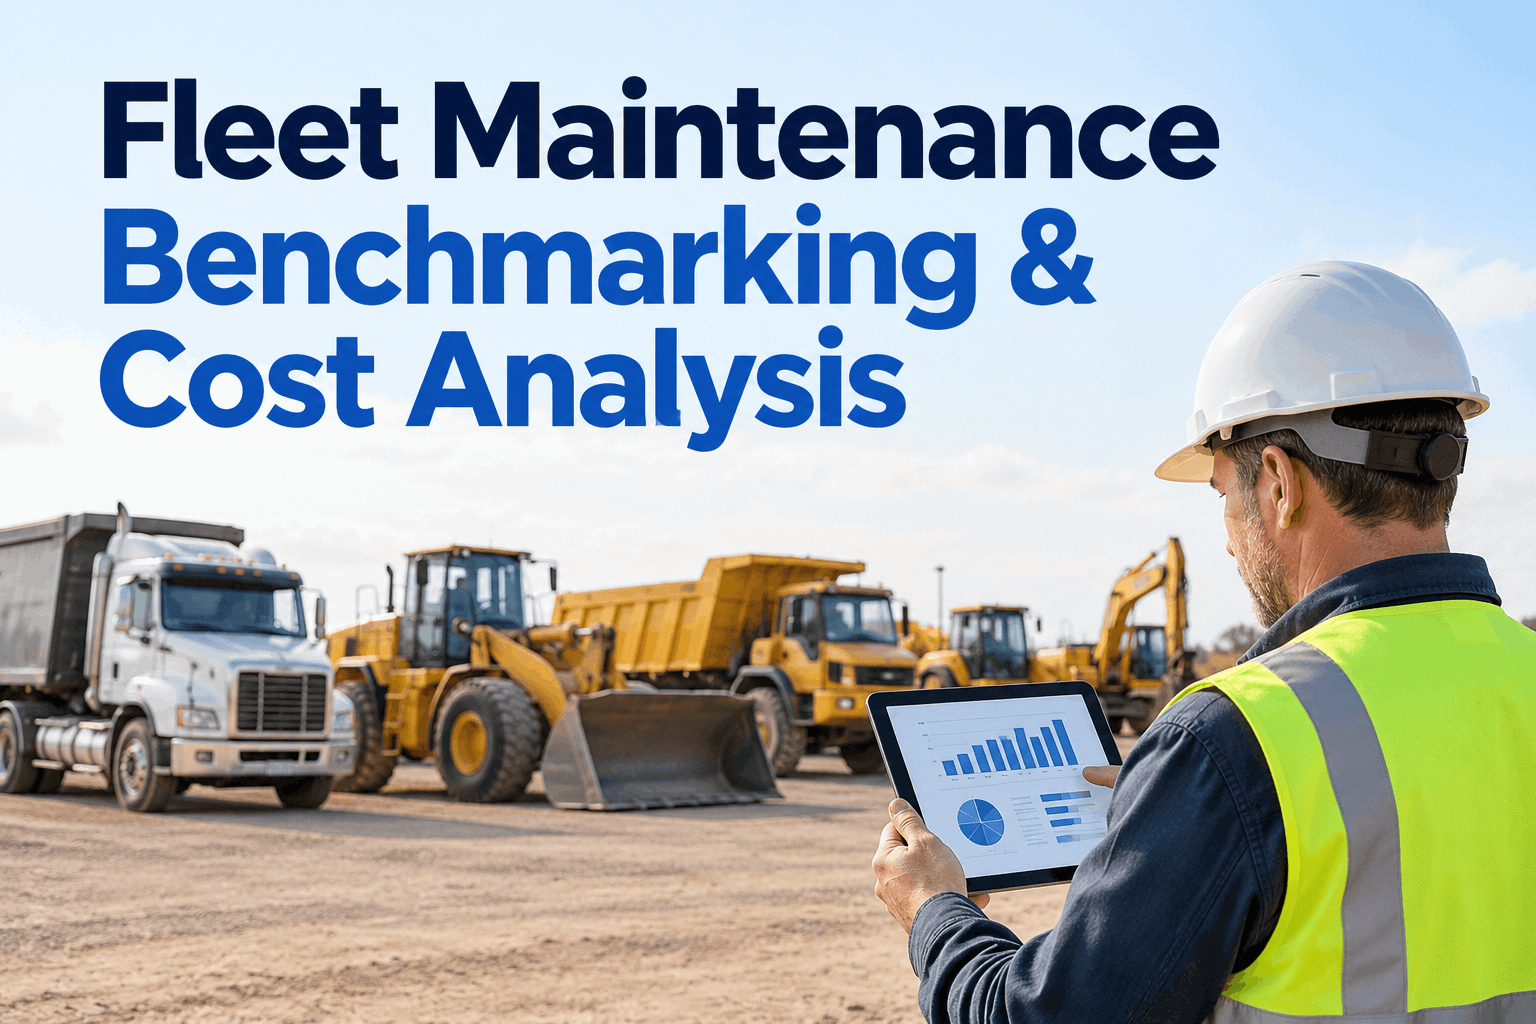
You already know, roughly, which machine is the money pit — the one always in the shop. But "roughly" doesn't survive a budget meeting.Fleet maintenance benchmarking turns that hunch into a number: this excavator costs $14 an hour and the identical one costs $31 — so where's the $17 going? The most useful comparison isn't an industry average you'll never match; it's your own fleet against itself, apples to apples. Book a demo of fleet cost comparison to see it on your own iron.
Benchmark your fleet against itself
Rank every asset by cost per hour, normalized by class, and the money pits surface on their own — no industry average required, just your own machines compared apples to apples.
Fleet maintenance benchmarking is comparing the maintenance cost and performance of your equipment — against each other, across sites, or against an external reference — on a normalized basis like cost per hour or per mile. Its job is to surface the outliers: the assets, sites or makes spending far more than their peers, so you know where to act instead of guessing.
There are two kinds of benchmarking, and most fleets skip the more useful one. External benchmarking compares you to other companies — helpful for a sanity check, but you rarely get a fair match. Internal benchmarking compares your own fleet against itself, and it's where the real money is found, because every comparison is apples to apples: same company, same operating conditions, same data. This guide focuses on the internal kind — how to normalize costs so comparisons are fair, which dimensions to compare, and how to turn the result into a decision.
Internal vs. external benchmarkingwhich fleet maintenance benchmarking actually drives action
Both have a place, but they answer different questions — and the internal one is the one you can act on this week without waiting on anyone else's data.
"Are we normal vs. the industry?"
- Compares your cost to other companies' averages
- Good for a yearly sanity check or a board slide
- Hard to match operating conditions and equipment mix
- You're at the mercy of someone else's data and definitions
"Which of our assets is the outlier?"
- Compares your own assets, sites and makes to each other
- Apples to apples — same company, same conditions, your data
- Pinpoints the exact machine or site to act on
- Actionable this week, no external report required
Run the external check once a year for context; run the internal comparison every month to actually manage cost. For the external side, HVI has a guide on what other companies spend — and for your own numbers, book a demo of internal asset comparison.
Normalize before you comparethe apples-to-apples rule that makes benchmarking fair
Raw cost lies. A machine that cost more this month might simply have worked more hours. Before any comparison means anything, the numbers have to be put on the same footing.
Divide by usage, not calendar
Cost per operating hour or per mile — not cost per month. A busy machine should cost more in total; the question is whether it costs more per unit of work.
Compare like with like
Group by equipment class and size before you rank. A 20-ton excavator against a skid steer tells you nothing; two 20-ton excavators tells you everything.
Split planned vs. reactive
Two machines at the same cost per hour aren't equal if one is all scheduled PM and the other is all breakdowns. The mix is the real health signal.
Hold the window steady
Compare the same time period across assets, long enough to smooth out a one-off big repair. A single blown transmission shouldn't brand a good machine a money pit.
Get normalization right and the comparison becomes honest — the outlier that surfaces is genuinely an outlier, not just the machine that worked the most. See the cost-per-mile benchmark guide for the on-road version, or start free and normalize your fleet's costs.
What to compare against whatthe four comparisons that surface the most waste
Once the numbers are normalized, the question is what to slice them by. These four comparisons catch the vast majority of hidden cost in a mixed fleet.
Asset vs. asset
Same class, side by side. The fastest way to spot the one machine costing double its twin.
Site vs. site
Same equipment, different yards. Big gaps point to local practices — PM discipline, operator care, a weak vendor.
Make vs. make
Cost per hour by brand or model. The data that should decide your next purchase, not the sales rep.
Now vs. then
Each asset against its own history. A rising cost-per-hour trend is a machine telling you it's wearing out.
Asset, site, make and trend — those four slices turn a flat cost number into a map of exactly where to act. See HVI's analytics and reporting that slices cost every one of these ways, or book a demo of fleet cost benchmarking.
Turning an outlier into a decisionwhat to do once fleet maintenance benchmarking flags a money pit
A ranked list is only worth the action it triggers. When a machine shows up at the bottom, it's not an answer — it's a question, and here's how to work it.
That's the whole payoff of fleet maintenance benchmarking: it doesn't just tell you what you spent, it tells you what to do next and then proves whether it worked. Start free and drill into your own costs, or book a demo of repair-vs-replace analysis.
From the fleet office
For years I chased external benchmarks — "the industry spends X per hour" — and it never fit, because nobody runs the same mix of machines on the same ground we do. The thing that actually saved money was ranking our own excavators against each other. Two identical units, and one was costing nearly double. Turned out it was always sent to the worst site with the roughest operator. We didn't need a new machine — we needed to rotate it. I never would have seen that without putting our own assets side by side.
Fleet maintenance benchmarking FAQs
What is fleet maintenance benchmarking?
Fleet maintenance benchmarking is comparing the maintenance cost and performance of your equipment on a normalized basis — such as cost per hour or per mile — against each other, across sites, or against an external reference. Its purpose is to surface the outliers spending far more than their peers so you know where to act.
What's the difference between internal and external benchmarking?
External benchmarking compares your fleet to other companies' averages — useful for a yearly sanity check but hard to match fairly. Internal benchmarking compares your own assets, sites and makes against each other, which is apples to apples and far more actionable, because every comparison uses your own data under your own operating conditions.
How do you compare fleet maintenance costs fairly?
Normalize first: divide cost by usage (per hour or per mile, not per month), compare like equipment classes only, split planned versus reactive spend, and hold the time window steady across assets. Without normalization a busy machine looks expensive simply because it worked more — the comparison has to put every asset on the same footing.
What should I compare across my fleet?
Four comparisons catch most hidden cost: asset vs. asset within the same class, site vs. site for the same equipment, make vs. make by brand or model, and each asset against its own history over time. Together they turn a flat cost figure into a map of exactly which machine, yard or brand to act on.
How does HVI help with fleet maintenance benchmarking?
HVI uses the work orders, costs and hours your team already logs to rank assets by cost per hour, normalized by class and split planned versus reactive, with drill-down to the repairs behind each number. It's built for internal benchmarking — comparing your own fleet against itself across assets, sites, makes and time to find the outliers.
Stop guessing which machine is the money pit
HVI turns the work orders and hours your team already logs into a ranked, normalized view of cost per asset — so the outliers surface on their own and you walk into the budget meeting with the number, not a hunch. See your own fleet benchmarked against itself — book a demo.
No credit card · See it on your own fleet · Cost analytics from day one