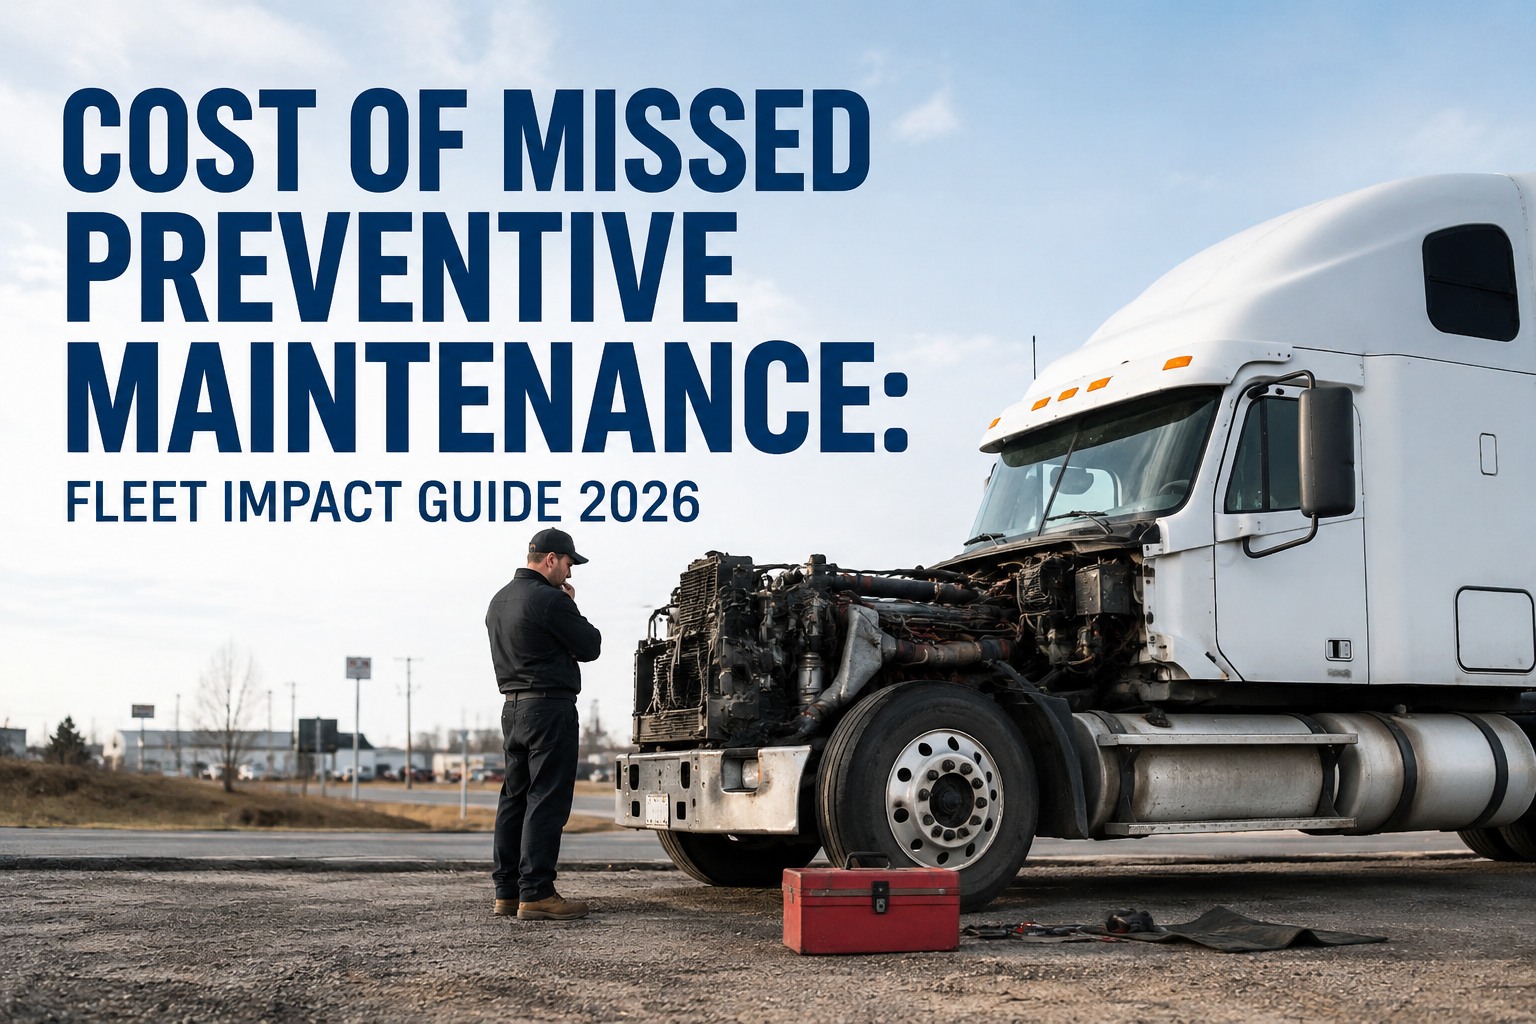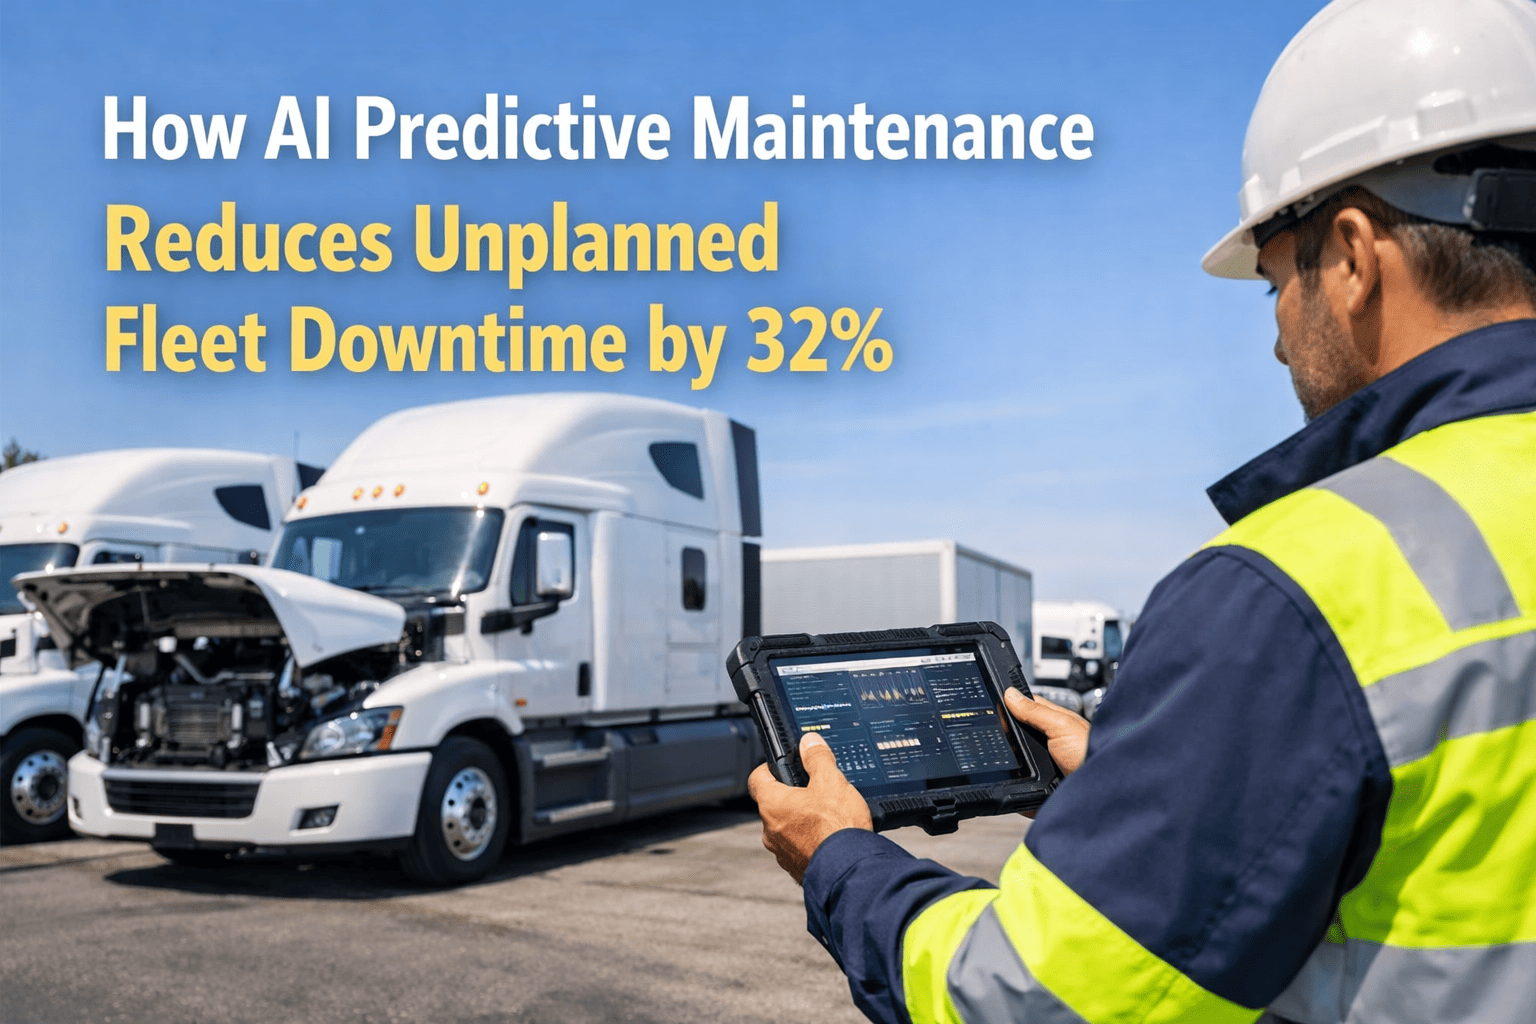
Fleet downtime isn't a maintenance problem — it's a profitability problem dressed up in mechanical language. The 2026 industry benchmarks are stark: every truck off the road costs $448–$760 per day in lost productivity, the average commercial vehicle loses 8.7 days a year to unplanned downtime, and 78% of those breakdowns are actually preventable. For a 25-truck fleet, that math translates to roughly $150,000–$200,000 per year in losses that didn't have to happen. The lever that turns those numbers around is preventive maintenance — specifically, PM scheduled on engine hours instead of memory, defect routing that catches problems before they cascade, and parts staging that compresses repair turnaround. Industry data confirms it: every $1 spent on preventive maintenance returns $4–$8 in avoided emergency repairs, towing, and downtime, and fleets running structured PM programs cut unplanned downtime 25–32% within the first year. This guide breaks down the true cost of fleet downtime, the specific PM mechanisms that reduce it, the ROI math worked through a 25-vehicle example, the planned-versus-reactive maturity model, and the 6 most common mistakes that erode PM returns. HVI's inspection and maintenance software is purpose-built for the preventive maintenance side of fleet cost control — engine-hour PM scheduling per VIN, automated work order generation, OEM-spec compliance tracking, and audit-ready records that protect both uptime and DOT compliance. Sign up for a free HVI trial to deploy engine-hour preventive maintenance scheduling across your fleet, or schedule a 30-minute walkthrough with the HVI team to see how HVI inspection and maintenance software measurably reduces downtime cost.
The hidden cost iceberg — what $448–$760/day actually includes
The headline downtime number is just the surface. When a truck breaks down on the road, the visible repair invoice is a fraction of the total economic damage. The cascade of secondary costs is where the real money disappears — and where preventive maintenance produces the biggest wins.
Why 78% of fleet downtime is preventable — and how PM closes the gap
Industry data is consistent across sources: roughly 78% of unplanned breakdowns originate from preventable causes — skipped oil changes, ignored minor issues, missed brake inspections, deferred tire rotations. The remaining 22% is genuinely unpredictable (random component failure, accident damage, weather events). Preventive maintenance attacks the 78% directly.
- Skipped oil and filter changes
- Missed brake inspections and adjustments
- Deferred tire rotation and pressure checks
- Ignored minor defects flagged in DVIRs
- Reactive-only maintenance posture
- Lack of engine-hour tracking
- Random component failure (defect, manufacturing)
- Accident damage and impact events
- Weather and road-hazard incidents
- Cargo-related mechanical strain
- Third-party fluid contamination
- Genuinely surprising electrical faults
The 4 PM levers that move the cost needle
Not all preventive maintenance is equal. The fleets that produce the 25–32% downtime reductions cited in industry studies use four specific operational levers — and the gap between the average fleet and the best-in-class is which of these four are actually automated versus aspirational.
PM intervals fired on actual engine hours per VIN — not on calendar dates or memory. Light-duty vehicles get less frequent service; heavy-use vehicles get more frequent. Eliminates the waste of premature service and the damage of overdue service.
Every "Fail" tap on a daily inspection auto-creates a maintenance work order with photo evidence and vehicle ID. Defects don't sit between shifts waiting to be entered — they route to the shop the moment they're flagged.
Critical parts pre-positioned based on PM forecasts. When a brake job is scheduled, the parts are already on the shelf. Eliminates the "waiting for parts" delay that turns a 4-hour service into a 3-day downtime event.
Each VIN carries its manufacturer's service schedule. Software flags 250 / 500 / 1,000 / 5,000-hour services automatically and tracks completion against OEM spec. Eliminates warranty disputes and the engine damage that ad-hoc service causes.
The $1 PM = $4–$8 saved math — visualized
Every $1 invested in preventive maintenance returns $4–$8 in avoided emergency repairs, towing, and downtime cost. The ratio holds across industry sources, fleet sizes, and vehicle classes — making PM the single highest-ROI activity in fleet operations. Here's what the math looks like applied to typical cost categories.
This is why preventive maintenance is treated as an investment, not an expense, in best-in-class fleet operations. The challenge isn't proving the ROI — it's making the PM schedule execute reliably across hundreds of vehicles without dependency on memory. Sign up for a free HVI trial and deploy engine-hour PM scheduling across every vehicle in your fleet in under an hour, or book a 30-minute demo with the HVI team to see the PM workflow in action on a fleet your size.
ROI worked example — a 25-vehicle fleet in 2026
Concrete numbers make the case. Here's what the downtime-cost picture looks like for a 25-vehicle medium-duty fleet — before and after a structured PM program, using mid-range industry savings rates.
The planned-versus-reactive maturity model
The industry average for planned-versus-reactive maintenance is 55:45 — meaning 45% of all maintenance is still emergency response. Best-in-class fleets achieve 80:20, and elite operators reach 90:10. The ratio is the single best indicator of where your operation sits on the cost curve.
Maintenance happens when things break. No documented PM schedule. Downtime cost runs above industry average. Vehicles fail roadside inspections regularly.
Some PM happens, mostly on calendar intervals. Defects logged on paper DVIRs that don't reliably route to work orders. Avg 8.7 days/vehicle annual downtime.
PM scheduled on engine hours per VIN, defect-to-work-order automation, parts pre-staged. Downtime cut 25–32%. Maintenance cost down 15–25%.
Predictive analytics + telematics + real-time monitoring layered on PM. 95–99% uptime, breakdowns engineered out of existence. Maintenance treated as investment.
The 5 PM intervals every fleet needs to track
A structured PM program covers five interval categories. Each has a different trigger (engine hours, mileage, or calendar), a different scope, and a different cost-control impact. Missing any one leaves a structural gap in the PM program.
Oil change, oil filter, fuel filter, air filter inspection. The single highest-impact PM service — skipping leads to direct engine damage and the most expensive emergency repair category.
Slack adjusters, brake lining, drums/rotors, air leak-down, ABS warning verification. Brakes are the #1 cause of OOS orders — quarterly attention prevents both downtime and CSA damage.
Tread depth measurement, pressure check, sidewall inspection, rotation. Underinflated tires cost ~3% MPG; worn tires are auto-OOS at 2/32" drive / 4/32" steer.
Transmission fluid, coolant flush, hydraulic fluid sampling. Lab analysis on samples can extend drain intervals 20–50%, cutting oil consumption and disposal cost.
Bushings, shocks, springs, U-bolts, alignment, frame inspection. For tracked equipment, full undercarriage wear measurement (sprocket, idler, rollers, chain, grouser).
Top 6 mistakes that erode PM ROI
These six errors cause the majority of underperforming PM programs. Each is preventable with disciplined process and the right software — and each one is a documented pattern across hundreds of fleet implementations.
Light-use vehicles waste oil and labor on premature service; heavy-use vehicles get damaged by overdue service. PM intervals must fire on actual engine hours per VIN to capture the full ROI.
Driver flags a brake issue on the DVIR, paper form goes in a tray, no one creates a work order. Defect sits 3 days. By then it's an emergency repair at 3–9× the cost of catching it Day 1.
PM scheduled for next week, but the brake kit isn't on the shelf. Service date slips, vehicle sits, downtime accumulates. Best-in-class fleets pre-stage parts based on PM forecasts.
All PMs scheduled the same week of every quarter — 30% of the fleet is offline simultaneously. Stagger the schedule so no more than 10–15% of vehicles are in PM at any one time.
You can't identify the vehicles costing more to maintain than replace if you don't track cost-per-mile or cost-per-hour per VIN. Rising CPM is the signal to schedule replacement evaluation.
PM happens, but the records aren't organized to prove it. FMCSA 49 CFR 396.3 requires documented PM schedule and execution. Paper records that can't be produced in 48 hours = audit finding.
HVI inspection & maintenance software — built for preventive maintenance ROI
HVI is purpose-built inspection and maintenance software for commercial fleets and heavy equipment, with preventive maintenance as the core platform feature. PM intervals fire on actual engine hours per VIN, defect-to-work-order routing builds the audit-defensible chain automatically, and cost-per-VIN data surfaces the replacement-evaluation signals the industry uses to extend fleet life. Every feature maps to a specific dollar in the $1-PM-equals-$4–$8 ROI equation.
PM intervals fired on actual engine hours, never on memory or calendar. Engine oil (250–500 hrs), brake inspection (quarterly), tire rotation (10–15K mi), fluid services (1,000–5,000 hrs), undercarriage (500–1,000 hrs) — all automatic.
Mobile-first daily inspections completed by drivers on smartphones in 5–12 minutes. Required fields, photo-verified defects, GPS-timestamped, archived per VIN. The compliance and PM feed both run through the same workflow.
Every "Fail" tap on an inspection auto-creates a maintenance work order with photo evidence and vehicle ID. Defects route to the shop the moment they're flagged — eliminating the 3-day delay that turns repairs into emergencies.
Every PM service, repair, part, technician hour, and outside-vendor invoice logged against the machine. Cost-per-engine-hour and reliability trends per VIN surface automatically — informing replacement timing and warranty decisions.
Each VIN carries its manufacturer's service schedule. Software flags 250 / 500 / 1,000 / 5,000-hour services automatically. Quarterly brake adjustments, annual 49 CFR 396 Appendix A inspections — all on the same calendar.
Documented PM schedule plus execution records covering 49 CFR 396.3(b) and 396.3(c) requirements. 14-month digital retention indexed by VIN — exportable as a unified audit package in under a minute.
The ROI gap between fleets running structured PM software and fleets running paper-based or memory-based PM is widening every year. The industry data is unambiguous, the math is documented, and the deployment friction has effectively disappeared. Sign up for a free HVI trial and deploy engine-hour preventive maintenance, guided eDVIRs, and defect-to-work-order routing across your entire fleet in under an hour, or schedule a 30-minute walkthrough with the HVI team to see the platform on a fleet similar to yours, with a live ROI projection for your specific operation.
Frequently asked questions
Q: How much does fleet downtime actually cost per vehicle per day?
Q: How much downtime does preventive maintenance actually prevent?
Q: What's the ROI of preventive maintenance for a fleet?
Q: What's the difference between calendar-based and engine-hour PM?
Q: What planned-to-reactive maintenance ratio should I target?
Q: What PM intervals does FMCSA require?
Q: How long does it take to see savings from a PM program?
Fleet downtime is a profitability problem with a documented solution. $1 in preventive maintenance returns $4–$8 — but only if the PM schedule actually executes.
HVI is purpose-built inspection and maintenance software for commercial and heavy equipment fleets. Engine-hour PM scheduling per VIN, guided eDVIRs, automatic defect-to-work-order routing, cost-per-VIN tracking, and audit-ready records. The platform that turns the $4–$8 PM ROI from a benchmark into your fleet's reality.
No credit card required · Engine-hour PM scheduling on day one · 49 CFR 396 audit-ready