Out-of-service (OOS) rate is your fleet's DOT credit score. Every roadside inspection that ends with a truck placed out-of-service — or a driver removed from duty — hits the CSA record for 12 to 24 months, drives up your insurance premiums, threatens your operating authority, and costs somewhere between $4,000 and $18,000 in direct fine, downtime, and cascade impact per incident. In 2025, the industry-average vehicle OOS rate hit 18.1%, and the driver OOS rate climbed to 5.9%. Best-in-class fleets run under 8% and 2%. The gap between those two numbers is entirely operational, and this guide walks through exactly how to close it — the top violations that put trucks and drivers OOS, the 3-cycle prevention workflow that dismantles them, and the honest cost math that makes compliance software the highest-ROI operational investment on the P&L. Book a demo when you want to see your OOS rate modeled on your fleet.
What's your fleet's OOS grade?
Every regulated fleet earns a letter grade based on its vehicle out-of-service rate. Here's the honest scale.
What actually triggers an out-of-service placement?
An out-of-service order is issued when a CVSA-certified inspector identifies a violation that meets the North American Standard Out-of-Service Criteria, updated every April 1. There are two independent triggers: a vehicle can be placed OOS for mechanical defects while the driver remains cleared, and a driver can be placed OOS for credential or hours-of-service issues while the vehicle stays legal. Below is the split.
Mechanical & equipment
- Brake system defects — slack adjuster, pushrod travel, air leak
- Tire condition — tread depth, sidewall damage, inflation
- Cargo securement failures
- Lighting & reflector defects
- Suspension & steering issues
- Frame & coupling device damage
- Fuel system leaks & exhaust routing
Credentials & hours
- Hours-of-service (HOS) violations
- No valid CDL or wrong class for vehicle
- Expired or missing medical certificate
- False records of duty status / ELD tampering
- Positive controlled substance / alcohol result
- Missing or invalid driver qualification file
- Failure to maintain electronic logging device
Each column has its own violation stack, its own root-cause fix, and its own tooling requirement. Cutting your vehicle OOS rate is a maintenance-and-inspection discipline problem. Cutting driver OOS is a scheduling-and-documentation discipline problem. Confusing the two — or trying to fix them with one tool — is the single biggest reason OOS rate reduction programs stall. Book a demo to see both dashboards side by side
The top 5 vehicle OOS violations (2025 data)
These five categories account for over 85% of all vehicle OOS placements. If your PM program specifically targets these — on the DVIR checklist, in the shop, and on the audit trail — your vehicle OOS rate falls faster than any other single intervention.
The top 5 driver OOS violations (2025 data)
Driver OOS violations are almost never mechanical — they're documentation, scheduling, and process failures. Which means the fix isn't in the shop; it's in the back office and on the ELD. Here's the 2025 ranking.
The 3-cycle OOS prevention framework
Every OOS violation is caught — or missed — at one of three checkpoints in the daily fleet cycle. Best-in-class fleets close all three; average fleets close one, maybe two. Here's the framework.
Pre-trip DVIR (Driver Vehicle Inspection Report)
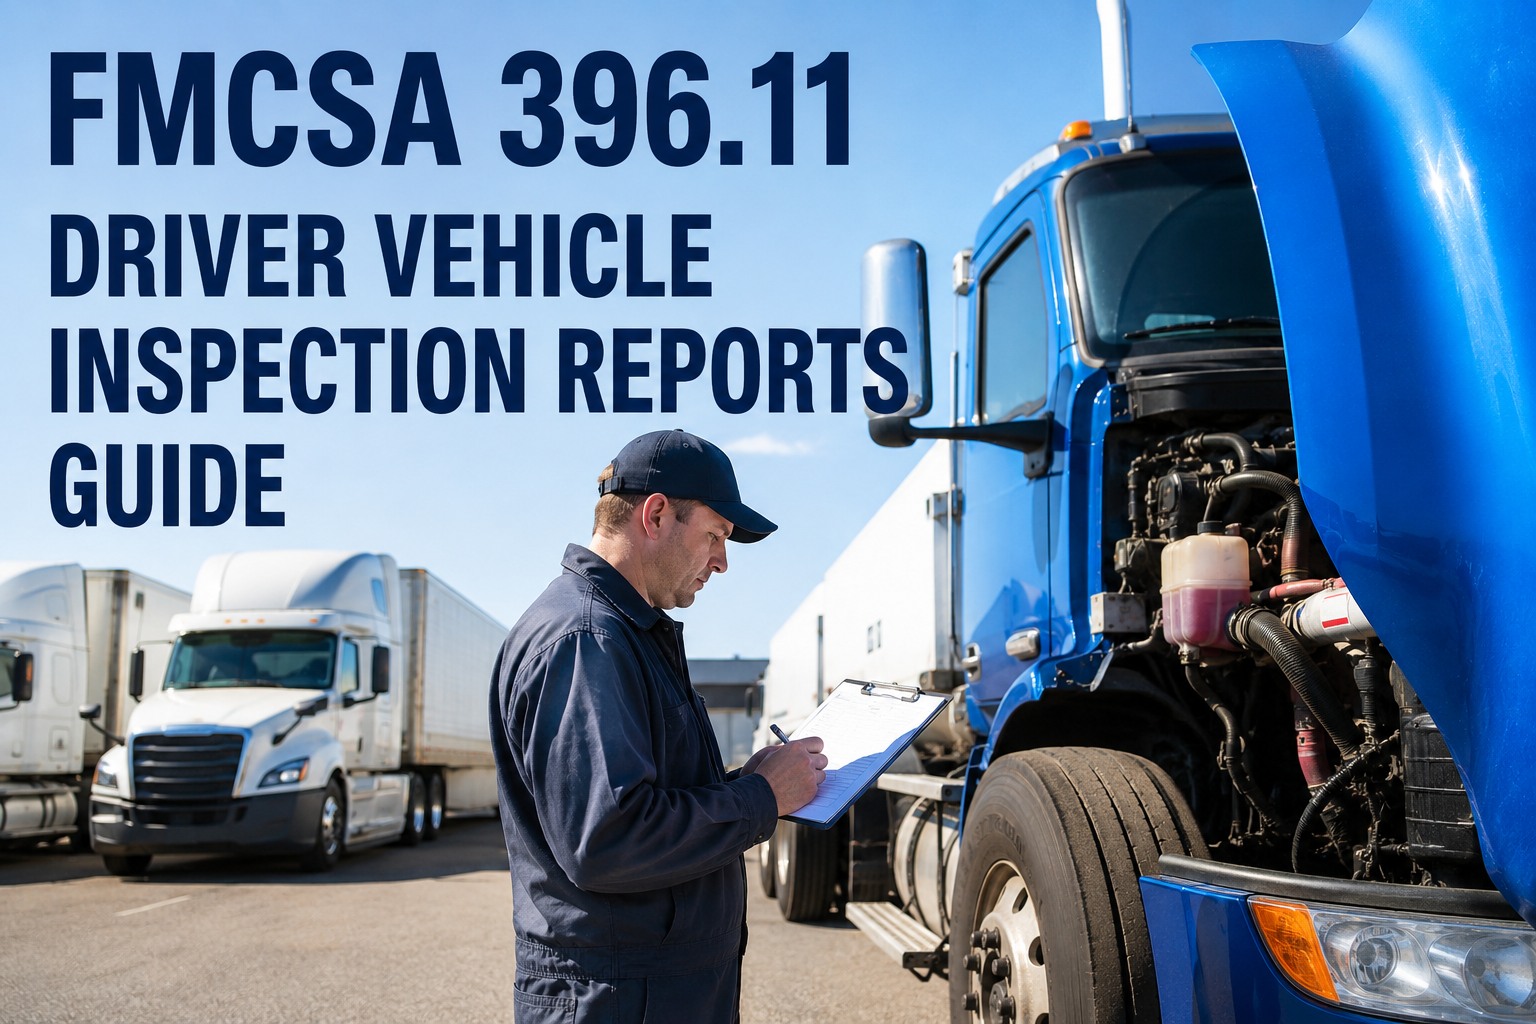
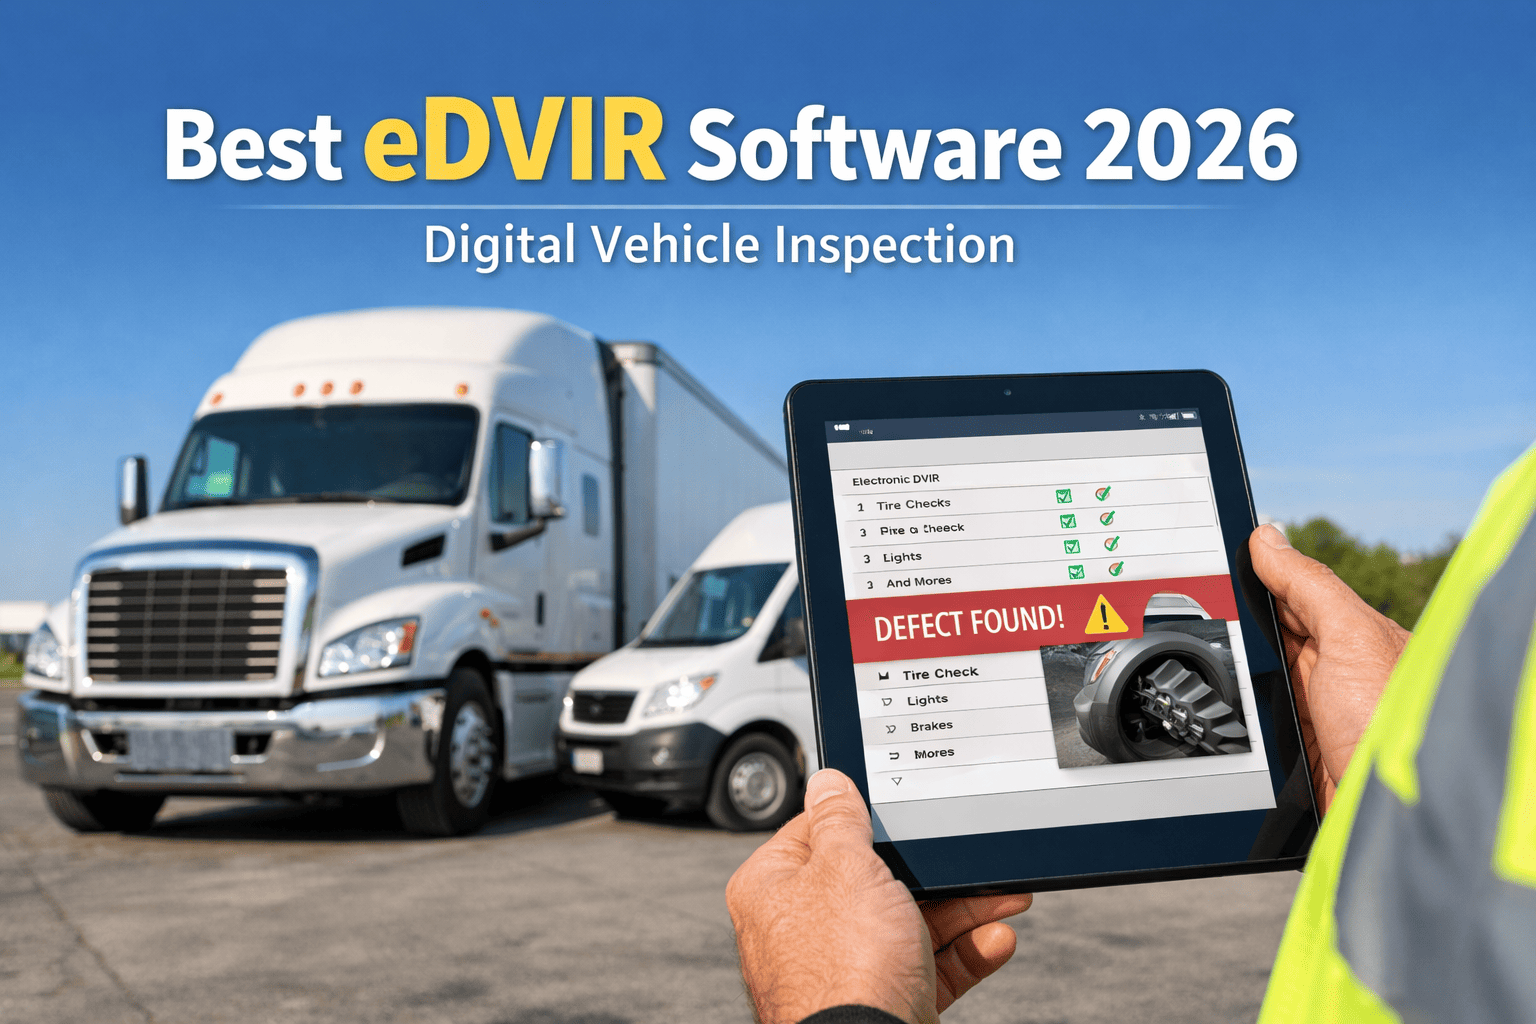
Required by 49 CFR 396.11. Digital DVIR with mandatory pass/fail responses on brake components, tires, lights, coupling, load securement, and driver credentials. Any defect classified as "unsafe to operate" auto-generates a work order and locks the vehicle from dispatch until repaired.
Scheduled PM + credential automation
Preventive maintenance auto-triggered at meter-based intervals, driver medical certificate and CDL expiration tracked with 90/60/30-day alerts, drug testing pool eligibility auto-verified. The system remembers everything the operations manager might miss.
Post-trip DVIR + defect closeout verification
Required by 49 CFR 396.11 — the post-trip DVIR is where drivers document defects they discovered during the shift. Defects flow to the maintenance queue with photo evidence, technician assignment, parts reservation, and photo-verified sign-off. Nothing gets closed on memory or verbal report.
Running all three cycles cleanly is the difference between an A grade fleet and a C grade one. The tooling to do it isn't complicated — but it does have to close all three loops, not just one. HVI's digital inspection platform handles the DVIR layer; the preventive maintenance module covers cycle 02. Book a demo to see all three cycles live
What a single OOS event actually costs
The direct fine is the smallest part of an OOS incident. The real cost is the cascade — downtime, downstream customer impact, CSA score damage, and insurance premium consequences that persist for 12 to 24 months. Here's the accumulation for a typical mid-fleet OOS event.
On a fleet running 100 tractors with an industry-average 18.1% vehicle OOS rate, that math implies 18 OOS events per year averaging $10,000 in total exposure — roughly $180,000 in annual unrecoverable cost. Cutting the rate to 8% recovers about $100,000 of that annually. The compliance software stack that makes it happen costs a small fraction. Start a free trial and get the cost model built on your fleet's actual numbers.
From C-grade to A-grade: the transformation blueprint
Cutting OOS rate isn't a single project — it's a stacked sequence of four disciplines, in order. Each one closes off a different violation source. Here's what a typical mid-fleet transformation looks like across 6 months.
- Paper DVIRs (or none)
- Spreadsheet PM tracking
- Manual credential expiration monitoring
- Reactive maintenance culture
- ~18 OOS events per year on 100 tractors
- Digital DVIR with pass/fail enforcement
- Meter-triggered PM automation
- 90/60/30-day credential expiration alerts
- Photo-verified defect closeout
- ~7 OOS events per year — a 60% reduction
That transformation isn't unique to a few outlier fleets — it's the observed pattern on the majority of HVI implementations. Start a free trial to load the digital DVIR templates and PM automation into your fleet this week.
From a safety director who cut OOS by 60% in 8 months
We were sitting at 21% vehicle OOS and 7% driver OOS. Industry average, honestly — but the CSA impact was starting to show in our insurance quotes. The board asked me to fix it and I inherited a paper DVIR system and a whiteboard for PM tracking.
The first change was digital DVIRs with mandatory brake and tire questions. That alone dropped us to 15% in the first quarter. Adding automated PM triggers and credential expiration alerts pulled us to 8.5% by month 8. That's 60% off our OOS rate. On a 74-truck fleet the direct recovery was about $85,000 — but the bigger win was the insurance premium coming in flat next year instead of the 12% increase we were quoted.
The bottom line on fleet out-of-service rate reduction
OOS rate is not a compliance metric — it's an operational leading indicator that shows up on the P&L, in the CSA score, and in the next insurance quote. The industry average of 18.1% vehicle OOS reflects fleets that haven't yet built the three-cycle prevention framework: digital pre-trip DVIRs that catch brake, tire, and lighting defects before dispatch; automated PM plus credential tracking between shifts; and photo-verified post-trip defect closeout. Best-in-class fleets running all three cycles hit sub-8% and hold it, recovering roughly $100,000 per 100 tractors annually in avoided direct and cascade costs, plus insurance premium stability that compounds year over year. The tooling to build this stack is smaller than the loss it prevents, and the payback typically lands inside a quarter. OOS rate reduction is the highest-ROI operational discipline available on any DOT-regulated fleet in 2026.
Frequently asked questions
What is a good fleet out-of-service rate?
The 2025 industry-average vehicle OOS rate from CVSA's International Roadcheck was 18.1%, and the driver OOS rate was 5.9%. Best-in-class fleets consistently run below 8% vehicle OOS and below 2% driver OOS. Anything above 25% vehicle OOS is CSA intervention territory — FMCSA typically sends warning letters or opens focused investigations at that threshold. The threshold matters more than the absolute number because CSA scores are calculated on a percentile basis against similar carriers, meaning your 18% OOS rate is average if your peer group averages 18%, but poor if your peer group averages 10%. Track your rate against the CVSA published national average and your specific industry vertical (LTL, TL, tanker, hazmat) rather than in isolation. Under the 2026 CSA overhaul, OOS violations carry double the weight of non-OOS violations, so the same rate produces a worse percentile score than it did in previous years.
What are the most common vehicle OOS violations?
Brake-related violations dominate vehicle OOS placements. In the 2025 CVSA Roadcheck, brake systems accounted for 24.4% of all vehicle OOS violations, and the "20% defective brakes" category (where at least one-fifth of a vehicle's brakes have OOS conditions) added another 20.0%. Combined, brake-related issues accounted for 41.1% of all vehicle OOS orders. Tire violations were second at 21.4% — tread depth below the 4/32" steer / 2/32" other requirement, flat or leaking tires, sidewall damage exposing cord ply, or improper load ratings. Cargo securement violations accounted for roughly 11%, and lighting/reflector defects added another 7.5%. Together, these five categories cover 85%+ of all vehicle OOS placements, which means a fleet that targets exactly these items in its DVIR and PM checklists can drive its OOS rate down significantly faster than one that inspects broadly without prioritization. Digital DVIRs with mandatory questions on brake pushrod stroke, air leaks, tire tread, and lighting have the highest ROI of any single inspection intervention.
What are the most common driver OOS violations?
Hours-of-service violations lead driver OOS placements at 32.4% of the 2025 total — primarily the 14-hour on-duty window, the 11-hour driving limit, and the 30-minute break requirement. No CDL / wrong-class CDL was second at 24.4%, driven mostly by expired licenses and drivers holding the wrong endorsement for the equipment they're operating. No medical certificate came in third at 14.9%, almost entirely due to expired DOT physicals that weren't renewed in time. False records of duty status (RODS) and ELD tampering accounted for 10% — a category the 2026 Roadcheck is specifically targeting. Alcohol and controlled substance violations rounded out the top five at approximately 6%. The critical pattern in these numbers: HOS, CDL, and medical certificate together (72% of all driver OOS) are 100% preventable with automated tracking. The system knows the driver's medical card expires next month; the driver may not. Automated 90/60/30-day expiration alerts eliminate this entire category of violation.
How does an OOS violation affect my CSA score?
Every OOS violation is recorded in FMCSA's Safety Measurement System and factors into the appropriate CSA BASIC (Behavior Analysis and Safety Improvement Category). Vehicle OOS violations typically load into the Vehicle Maintenance BASIC, driver OOS into Unsafe Driving or HOS Compliance, and hazmat OOS into HM Compliance. Under the 2026 CSA overhaul that took effect this year, OOS violations carry double the severity weight of non-OOS violations (weight 2 vs weight 1), so a single OOS placement moves your BASIC percentile more than it used to. Additionally, the counting window for violations dropped from 24 months to 12 months — violations age off faster, but a single high-severity OOS event lands harder while it's active. Vehicle Maintenance BASIC was also split into a standard category and a new "Driver Observed" category, which specifically captures defects that should have been caught on the pre-trip DVIR. Elevated CSA percentiles trigger warning letters starting around the 60th percentile in most categories, and focused investigations at higher thresholds. Insurance underwriters pull CSA data directly and adjust premiums accordingly.
Can fleet inspection software reduce OOS rate?
Yes — and the mechanism is straightforward. Digital DVIR software catches brake, tire, lighting, and cargo securement defects at the pre-trip and post-trip checkpoints, before the vehicle leaves the yard. Automated preventive maintenance triggers PM at meter-based intervals so brake components, tires, and other high-OOS-risk items get serviced before they fail an inspection. Credential tracking modules monitor CDL expirations, medical card renewals, and drug pool eligibility, sending 90/60/30-day alerts to fleet managers so no driver ever runs a shift with expired paperwork. Photo-verified defect closeout ensures repairs are actually completed and documented, creating an audit trail if a violation is challenged. Fleets that implement this stack cleanly typically report vehicle OOS rate reductions of 40–60% within the first two quarters of deployment. On a mid-size fleet, that's usually six-figure recovered cost annually in direct fines, downtime, cascade impact, and insurance premium stability. Payback windows commonly land inside a single quarter. Digital compliance software isn't a nice-to-have on a DOT-regulated fleet in 2026; it's the operational baseline.
Move your fleet from C grade to A grade — and hold it
HVI gives you digital pre-trip and post-trip DVIRs, meter-triggered PM automation, driver credential expiration tracking with 90/60/30-day alerts, and a live OOS exposure dashboard that shows exactly which trucks and drivers are at risk before the next inspection. Live in under two weeks — typical payback inside a quarter on recovered fine, downtime, and insurance impact alone.
No credit card · DOT/FMCSA-ready templates · Works with any ELD provider