The maintenance director says the new inspection program is clearly working — fewer breakdowns, calmer dispatch board, happier drivers. Finance asks for the number. There's a pause. "Fewer breakdowns than what, exactly, and compared to when?" Prevention is invisible by definition — it's the failure that didn't happen — which makes maintenance ROI measurement the hardest number in the building to prove and the easiest one to lose a budget fight over.
Maintenance ROI Measurement: Proving What Prevention Actually Saved
A documented 25% maintenance cost reduction and a 3-month payback are figures that survive scrutiny. A verbal "it feels like we're doing better" doesn't. The difference is entirely in how the baseline, the metrics, and the attribution were handled before anyone tried to prove anything.
Why Prevention Is the Hardest Thing to Prove
Every credible ROI case starts in the same place, and most weak ones skip it entirely: a baseline captured before the change, not reconstructed from memory after someone's already convinced it worked. A baseline built after the fact bends toward whatever answer the person building it already believes.
Skip step one and every later number is a guess dressed up as a result. Finance doesn't need to trust the maintenance team's intuition — it needs a before-and-after built on the same measurement, taken the same way, at two different points in time.
The Four Metrics Finance Will Actually Accept
Not every maintenance metric survives a finance review. The ones that do share one trait: they're countable, and they move in a direction that can be attributed to a specific change rather than general business noise.
Breakdown Frequency
Road calls and failures per unit, per period — a clean count, not an estimate.
Downtime Hours
Hours an asset sits out of service, scheduled and unscheduled, tracked separately.
Cost per Operating Unit
Spend per vehicle, per mile, or per hour — the figure that translates directly into a finance line item.
Reactive Share of Total Work
What percentage of work orders are unplanned repairs versus scheduled maintenance — the ratio a good program should visibly shift.
Attribution Honesty: Don't Claim What Shifted for Other Reasons
Fleet composition changes. Mileage changes. The application a vehicle runs changes. A case that ignores all three and credits the entire cost swing to the maintenance program is the first thing a sharp CFO will pick apart — and once one number looks inflated, every other number in the deck gets questioned too.
Cost Avoidance vs. Measured Reduction: Which Argument Survives Scrutiny
"We avoided a failure" is a weaker claim than "failures went down," even when both might be true. One is a counterfactual nobody can fully verify; the other is a number anyone can recount from the same data.
Claimed Cost Avoidance
- Relies on an unprovable counterfactual
- Easy to inflate without anyone noticing
- Hard to defend under direct questioning
- Useful as color, weak as primary evidence
Measured Reduction
- Based on two real counts, before and after
- Reproducible by anyone who checks the data
- Holds up under a direct finance challenge
- The foundation of a credible ROI case
A strong case leads with measured reduction and uses cost avoidance only as supporting narrative, never as the headline number.
From a Maintenance Director Who Rebuilt the Case Finance Actually Believed
My first ROI pitch was a slide full of "we think" and "roughly." It got fifteen minutes of polite nodding and zero budget. The second time, I had six months of baseline data before I changed anything, then six months after, same metrics, same vehicles, normalized for mileage.
The number held up because every figure traced back to a report anyone in finance could pull themselves. That's the whole difference — not a better story, just evidence that didn't need me in the room to be believed.
Payback Framing That Finance Signs Off On
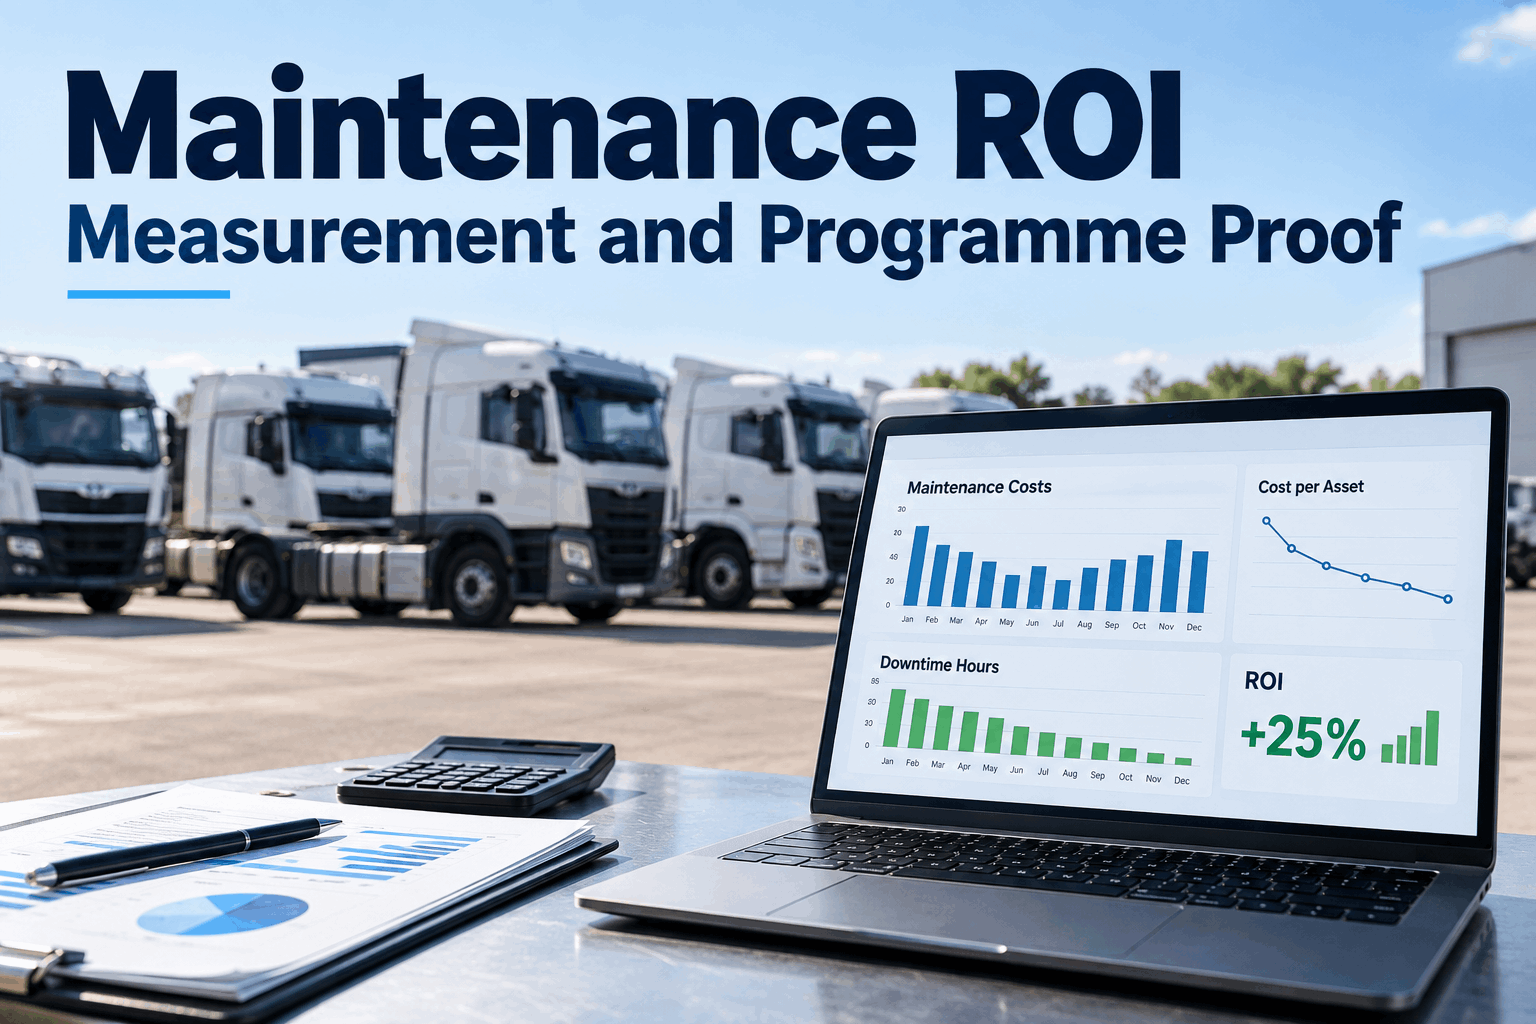
A documented three-month payback and a 25% cost reduction are specific, checkable, and modest enough to be believable — which is exactly why they survive scrutiny better than a vague "massive savings" claim. Book a demo to see how a payback calculation looks when it's built from your fleet's actual baseline instead of an industry average.
Frame payback the way finance already thinks about capital: investment cost divided by monthly net savings. A $20,000 annual program cost against $7,000 a month in measured maintenance savings is a three-month payback — a sentence, not a slide deck, and it's the sentence that actually gets remembered in the budget meeting.
Keeping the Case Current: Reporting Cadence
An ROI case proven once and never revisited eventually looks like a single lucky quarter. Reporting the same four metrics on a recurring cadence — monthly for operational tracking, quarterly for the finance review — keeps the case alive and makes next year's budget conversation a continuation, not a rebuild from zero. Sign up for a free trial to see that recurring report generated automatically instead of rebuilt by hand every quarter.
Conclusion: Maintenance ROI Measurement Is a Discipline, Not a Pitch
Prevention will always be invisible in the moment — the breakdown that didn't happen leaves no mark to point to. Maintenance ROI measurement closes that gap by replacing the invisible with the documented: a baseline captured before the change, metrics finance already trusts, honest attribution for everything that shifted for other reasons, and a payback number specific enough to survive a direct question. Programs that measure this way don't just get funded once — they get re-funded every budget cycle, because the evidence doesn't depend on anyone in the room remembering why it worked. Book a demo to see what your own baseline-to-result case would look like with cost-per-asset data already in hand.
Frequently Asked Questions
Why is it hard to prove the ROI of a maintenance programme?
Maintenance ROI is difficult to prove because its primary benefit is prevention — a failure that never happened leaves no direct evidence of its own avoidance. Without a baseline captured before a change is made, there is nothing concrete to compare results against, which forces teams to rely on reconstructed estimates or anecdotal impressions that rarely hold up to financial scrutiny.
What metrics should be used to measure maintenance programme ROI?
The most defensible metrics are countable and attributable: breakdown or road-event frequency, downtime hours, cost per operating unit (such as cost per vehicle, mile, or hour), and the reactive share of total maintenance work compared to planned work. These metrics are generally accepted because they can be tracked consistently before and after a change and are less open to subjective interpretation than broader claims about overall fleet performance.
What is the difference between cost avoidance and a measured cost reduction?
Cost avoidance refers to a claimed failure or cost that was prevented, which relies on an unprovable counterfactual about what would have happened otherwise. A measured cost reduction compares two actual, documented figures — before and after a change — making it reproducible and far more credible under financial review. A strong ROI case leads with measured reduction and treats cost avoidance as supporting context rather than primary evidence.
How should attribution be handled when other factors also changed?
A defensible ROI case accounts for other variables that could explain part of a cost or performance change, such as shifts in fleet composition, mileage, or application or duty cycle. Rather than attributing the entire improvement to the maintenance programme, normalizing results — for example, reporting cost per mile or per hour instead of a raw total — helps isolate the effect of the programme itself from unrelated operational changes.
What payback period is realistic for a maintenance programme investment?
Documented results across many fleets commonly show a payback period of around three months alongside a maintenance cost reduction in the range of 25%, when the case is built on real baseline data rather than industry averages. These figures tend to be credible specifically because they are modest, specific, and traceable to actual before-and-after measurements rather than optimistic projections.
Build a maintenance ROI case finance can verify themselves
HVI tracks cost per asset, downtime, breakdown frequency, and reactive-versus-planned work automatically — giving you a documented baseline and a measured result finance can check line by line, not just take your word for.
No credit card · Cost-per-asset reporting built in · Live in under two weeks