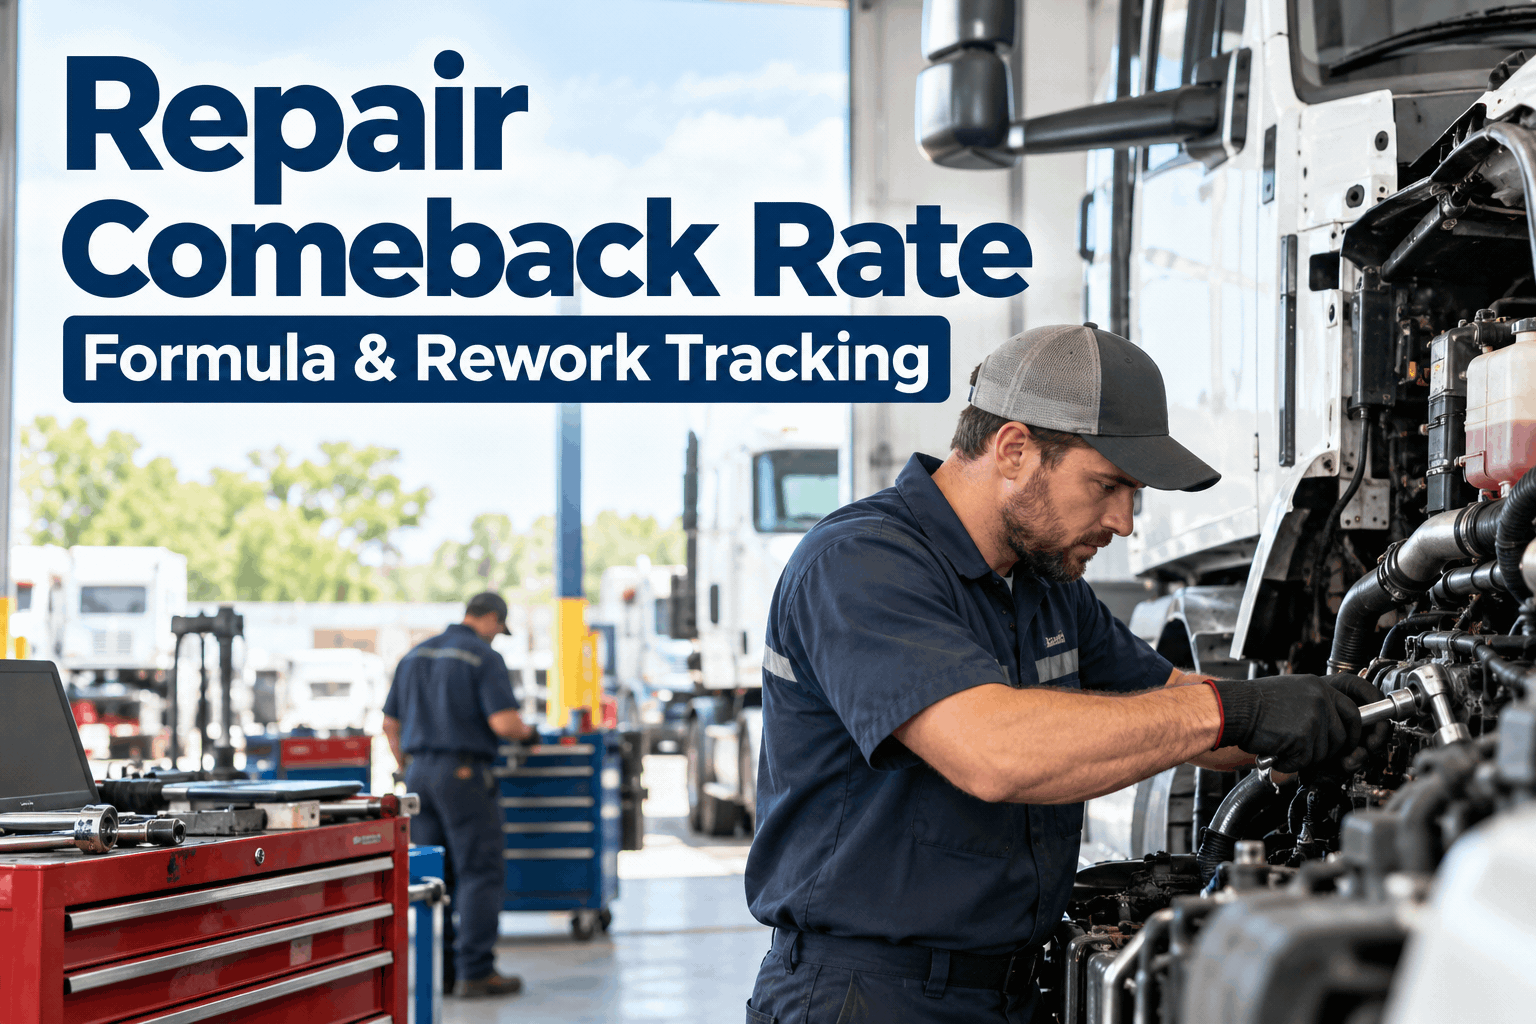
Repair comeback rate tells a fleet shop how often a completed repair comes back with the same unresolved fault. It is a practical quality signal: every avoidable return consumes technician hours, ties up a bay and can keep a vehicle out of service twice. This guide explains the formula, how to distinguish a true comeback from a new failure, and how to use repair records to prevent repeat work. Sign up free to organize fleet repair history.
Repair Comeback Rate: Find the Repairs That Return
One repair closes. The truck leaves. Then the same fault brings it back. Make the second visit visible—and find out why the first repair did not hold.
Is It a Comeback—or a Different Repair?
Do not count every return to the workshop as rework. Establish the classification before you calculate the KPI.
Same unresolved fault
Same symptom or failed repair within the defined follow-up window, with evidence linking the repeat job to the original work.
Example: repaired brake warning reappears six days later because the original wiring fault remains.New or unrelated issue
A different component fails, routine PM becomes due, or an unrelated fault is found on the next visit.
Example: a new tire puncture after a completed brake repair.Agree on a consistent follow-up window (such as 14 or 30 days) and review ambiguous cases. These windows are policy examples, not universal standards. Book a demo to review how HVI repair records support comeback investigations.
Repair Comeback Rate Formula and Example
Measure the share of completed repair jobs that generate a qualifying comeback in your chosen observation window.
Keep the numerator and denominator aligned. For a reliable monthly report, consider a cohort of repairs completed in the month and allow each one to finish its follow-up window before finalizing the rate. Otherwise, repairs closed near month-end may appear successful simply because there has not been enough time for a return.
Follow One Comeback Back to Its Original Work Order
A percentage points to the problem. A linked repair trail tells the supervisor what to correct.
Truck 27 · Intermittent brake warning
Connector replaced; warning cleared. Work order #1842 closed after shop check.
Driver reports the brake warning. Return work order #1899 linked to #1842.
Follow-up diagnosis finds chafed wiring farther along the harness. Repair procedure and verification checklist are updated.
What Does One Comeback Cost the Shop?
Count more than the replacement part. The second visit often disrupts bay capacity, dispatch plans, and service availability.
12 comebacks at this example cost would represent $6,600 in combined rework and disruption estimates.
Example figures are hypothetical; calculate your own labor rates, parts, vehicle availability impact and any warranty recovery. Do not present estimated disruption as an actual accounting expense without a defined method.
Where Repeat Repairs Start
Classify causes by process—not by technician name alone. That makes the metric actionable rather than punitive.
Diagnosis
Symptom treated, underlying fault missed; incomplete fault-code or inspection evidence.
Response: diagnostic checklist and escalation pathParts
Incorrect specification, poor-quality replacement or a related component left in service.
Response: verify part fit and associated componentsRepair execution
Installation, adjustment or torque step not completed or documented.
Response: job-specific quality checkpointsRelease verification
Vehicle returned to service without reproducing or validating the original fault condition.
Response: functional test and sign-offRecord a cause category and evidence for each confirmed comeback. Over several review cycles, the distribution reveals whether your shop needs better diagnosis, parts controls, job procedures or final testing. Sign up free to keep repair records and follow-up actions organized.
The Repair-Quality Loop: From Release to Learning
Use a consistent closeout and comeback review process so repeat work becomes a preventable pattern, not an unexplained cost.
Turn Repair Records into Better Quality Reviews
HVI's fleet maintenance workflows can support the evidence needed for comeback reviews. A formal automated comeback-rate report should be confirmed during a product demonstration.
Capture
Use inspections and defect records to document the vehicle condition and reported problem.
Connect
Maintain work orders and repair history by asset; reference the original job when logging a repeat issue.
Review
Use available maintenance records and reporting to investigate repeat work and identify patterns.
Improve
Update shop checks, parts practices and preventive maintenance plans based on documented findings.
Want to evaluate the workflow using your fleet's repair scenarios? Book a demo to review HVI work orders and maintenance reporting for comeback tracking.
Repair Comeback Rate: Common Questions
What is repair comeback rate in fleet maintenance?
Repair comeback rate is the percentage of eligible completed repair jobs followed by a qualifying repeat visit for the same unresolved issue within a defined observation period. It helps assess repair quality and avoidable rework.
How do you calculate repair comeback rate?
Divide qualifying comeback repairs by eligible completed repairs and multiply by 100. For example, 12 qualifying comebacks from 200 eligible repairs produce a 6% comeback rate. Use a consistent follow-up window.
What is a good repair comeback rate benchmark?
There is no single universal fleet repair comeback benchmark. Definitions, vehicle mix, job complexity and follow-up windows differ. Establish a reliable baseline, investigate trends, and set a realistic improvement target for your shop.
How is comeback rate different from first-time fix rate?
First-time fix rate looks at repairs resolved successfully on the first attempt. Comeback rate measures qualifying repeat visits after repairs are completed. They are related but may not be exact complements because their measurement rules and exclusions can differ.
How can HVI help track repeat fleet repairs?
HVI provides maintenance records, inspections and work-order workflows that can help teams document defects, retain repair history and investigate repeat issues. Ask for a demonstration to verify which reports and configuration options best support your shop's comeback-rate method.