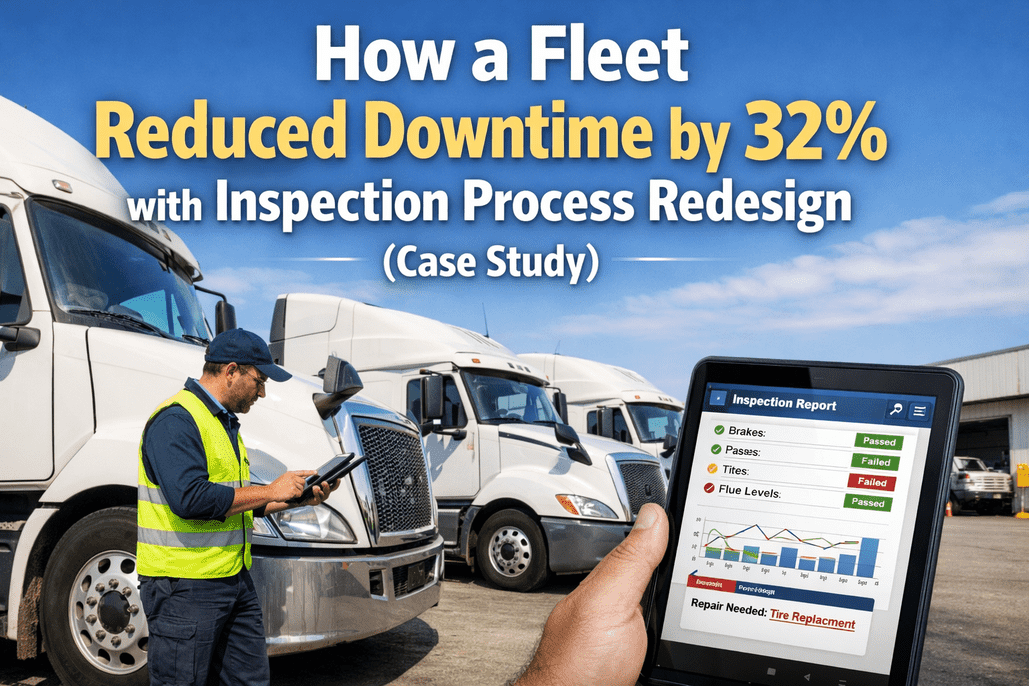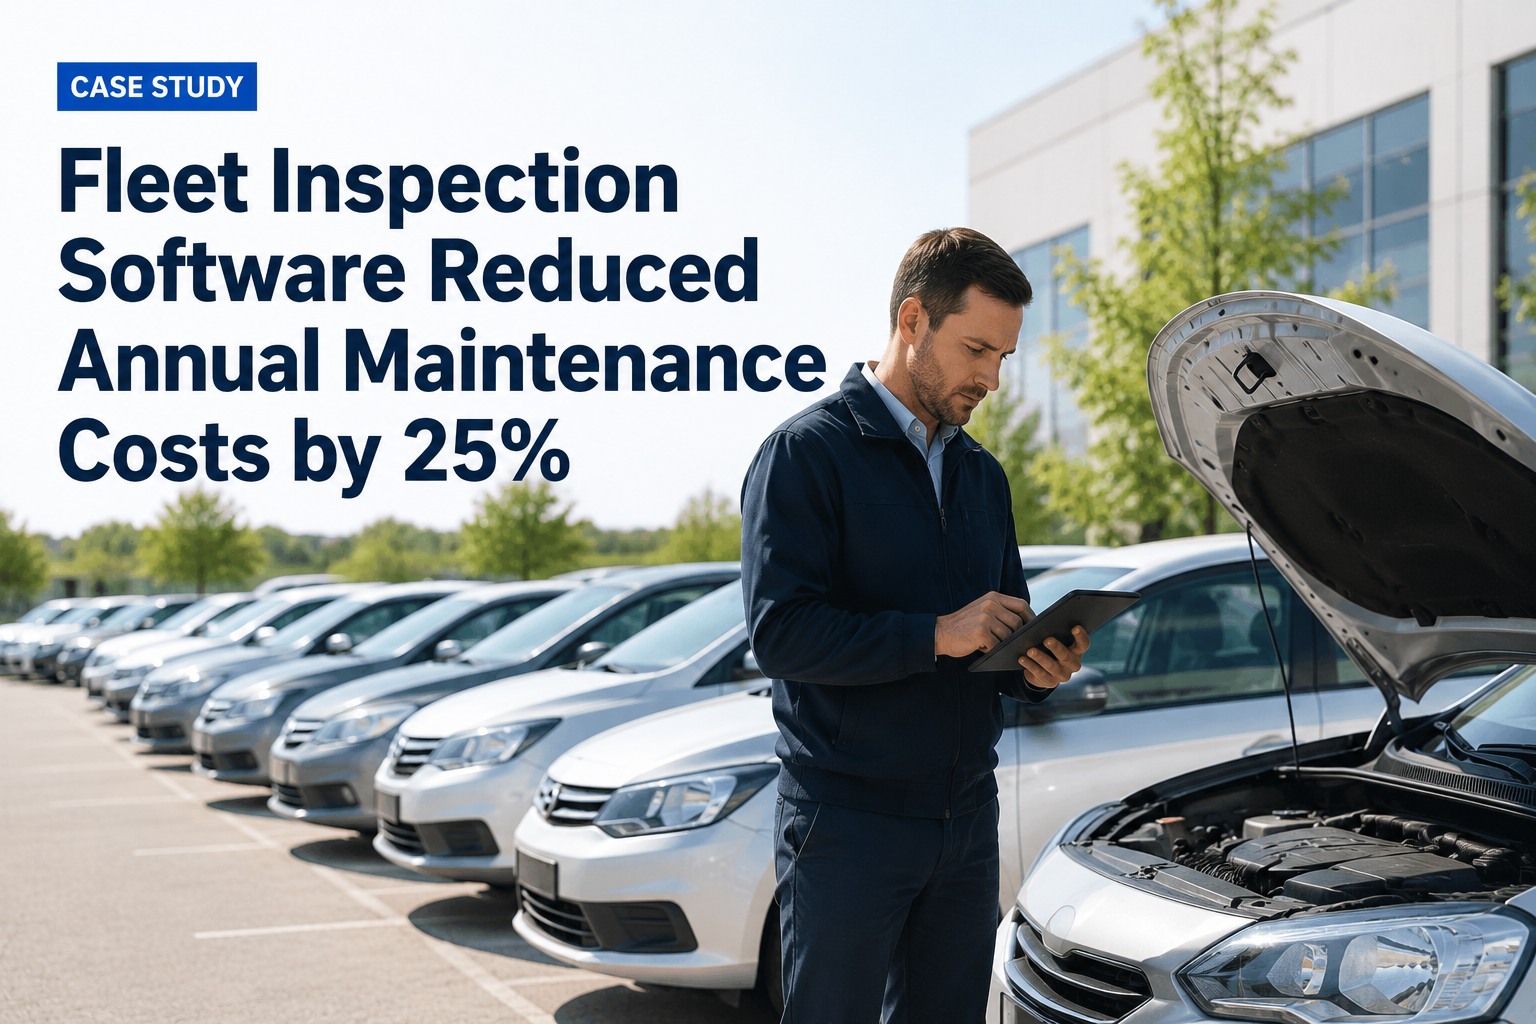
This fleet was spending $1.86 million per year maintaining 95 commercial vehicles—and 42% of that budget was going to emergency repairs that cost 3-5x more than the same fix done proactively. Paper inspections missed the defects. Spreadsheet scheduling missed the intervals. And by the time a problem surfaced, it was a roadside breakdown with a tow bill, a stranded driver, and a repair invoice at premium shop rates. After implementing HVI's fleet inspection software with digital DVIRs, automated PM scheduling, and component-level cost analytics, the fleet reduced total annual maintenance costs by 25%—saving $465,000 in the first year—while improving fleet availability from 86% to 95%. Start your free trial to see your fleet's real maintenance costs, or book a demo to see HVI's maintenance analytics.
Fleet Profile
This regional freight and last-mile delivery fleet operates a mix of Class 6-8 trucks from two maintenance facilities, running 6 days per week across a 4-state service area.
Fleet Overview
Where $1.86M Was Actually Going
The fleet's maintenance budget looked like a single number on the P&L. When they broke it down by repair type, the picture changed dramatically—42% of every maintenance dollar was going to reactive, emergency work that could have been prevented. Schedule a consultation to analyze your fleet's maintenance cost split.
Maintenance Spend by Type
The Reactive Repair Multiplier
What the Inspection Software Changed
HVI didn't just digitize inspections—it connected defect detection to work order creation to cost tracking, creating a closed loop that turned data into action and action into measurable savings. Start your free trial to build this loop for your fleet.
Digital Pre-Trip DVIRs
Photo-verified defects caught 24-36 hours earlier than paper. Brake wear, fluid leaks, light failures, tire issues—flagged before they become breakdowns.
Automated PM Triggers
Service intervals tracked by mileage, engine hours, and calendar—whichever comes first. No missed PMs. No over-servicing on light-duty vehicles.
Instant Work Orders
Defects route to the shop with photos and severity ratings. Mechanics see the problem before the truck arrives. Parts pre-staged. No diagnostic guessing.
Cost Analytics
Per-vehicle, per-component, per-shop cost tracking. Identifies the 10% of trucks consuming 40% of the budget—and why.
42% of Your Maintenance Budget Could Be Emergency Repairs
Digital inspections catch defects 24-36 hours earlier—turning $2,800 emergencies into $680 planned repairs.
12-Month Results
After 12 months on HVI, the fleet's maintenance budget dropped from $1.86 million to $1.395 million. The emergency repair share flipped from 42% to 14% of total spend—and the savings compounded as components lasted longer under proper preventive care.
Maintenance Mix: Before vs. After
The goal isn't zero maintenance cost—it's shifting every possible dollar from reactive to preventive, where it costs 3-5x less.
Complete Before / After Comparison
| Metric | Before HVI | After HVI |
|---|---|---|
| Total annual maintenance | $1,860,000 | $1,395,000 |
| Cost per vehicle per year | $19,600 | $14,700 |
| Emergency repair share | 42% | 14% |
| Roadside breakdowns / month | 11 | 2 |
| PM compliance rate | 64% | 97% |
| Fleet availability | 86% | 95% |
| Avg. brake component life | 58,000 mi | 74,000 mi |
| Parts rush-order frequency | 18/month | 3/month |
Where the $465K Came From
"For years I told ownership we needed a bigger maintenance budget. Turns out we didn't need more money—we needed to stop spending 42 cents of every maintenance dollar on emergencies. Once HVI showed us the cost-per-repair difference between a planned brake job and a roadside brake failure—$680 vs. $2,850 for the exact same repair—the business case made itself. We cut our maintenance budget by $465,000 without cutting a single PM. We actually do more preventive work now than before—it just costs a fraction of what we were paying in emergency mode."
Cut Your Maintenance Costs by 25%
The math is simple: every emergency repair you prevent saves 3-5x its planned cost. Fleet inspection software catches the defects that create emergencies—24-36 hours before they become roadside breakdowns. Start your free trial and see where your maintenance dollars are actually going.
$465K Saved. 25% Lower Costs. Same Fleet, Smarter Maintenance.
Digital inspections, automated PM scheduling, and cost analytics — built for fleets ready to stop paying emergency prices for routine repairs.