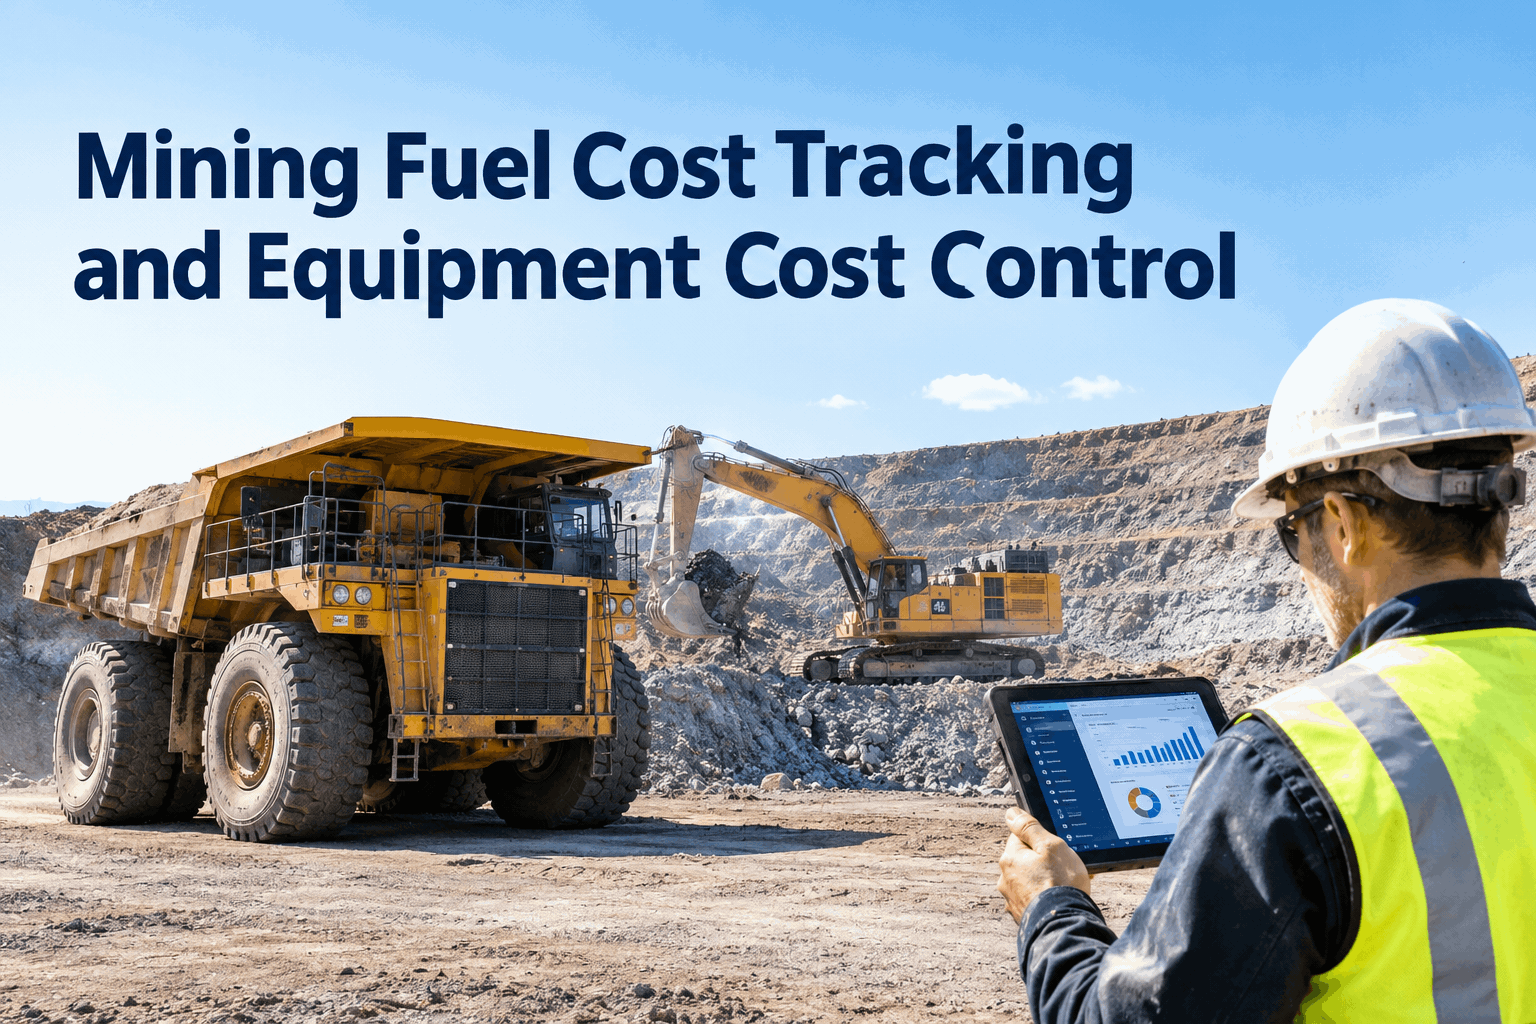
The fuel invoice at the end of the month tells you what the fleet burned. It doesn't tell you which truck, which operator, or how many of those gallons went up the stack while a machine sat idling. Mining fuel cost tracking closes that gap — tying fuel, parts, labor, and downtime to each asset so the cost per hour stops being a mystery. See how it turns one big line on the P&L into a list you can act on, then book a demo to map it to your fleet .
Stop Reading the Fuel Bill. Start Controlling It.
Tie fuel, parts, labor, and downtime to every haul truck, shovel, loader, and drill — and finally see the real cost per hour, ranked across the whole fleet.
On most mine sites, fuel is one of the two or three largest controllable costs there is — diesel runs roughly 30–50% of open-pit transportation cost. But the fuel card and the monthly invoice only show the total. They don't show that the third truck on B-crew burns 15% more than its twin on the same route, or that a loader idling through every shift change is quietly costing $300 an hour in fuel and wear. You can't manage what you can only see as one number. This page is about breaking that number apart — per asset, per hour, per cause.
Where the fuel money actually leaksfour cost drivers the monthly invoice hides — and what each one costs
A high fuel bill isn't one problem. It's a handful of specific, fixable behaviors, each invisible until you attribute spend to the machine and the shift that caused it. Here's where mining fuel cost quietly drains away.
Unnecessary idling
A large haul truck idling for no reason can cost over $300 an hour once fuel, accelerated wear, and clogged emissions components are counted. Across a fleet, it's the single biggest invisible leak.
Uneven & over-loading
Poorly matched loads push fuel use per haul cycle up by a double-digit percentage. Without per-truck tracking, nobody sees which machines are running inefficient cycles shift after shift.
Operator & machine variance
Two identical trucks on the same route rarely burn the same fuel. The gap is operator habit and machine condition — and it only shows up when you compare cost per hour side by side.
Neglected maintenance
A dirty air filter, dragging brakes, or low tire pressure quietly raises burn. Tie fuel trend to maintenance history and a rising cost-per-hour curve points straight at the machine that needs service.
Each of these is only fixable once it's measured against the asset that caused it. HVI's fuel log and cost tracking records fuel against each machine and ties it to usage, so the leak has a name and a number instead of hiding in the fleet total. Book a demo to see per-asset fuel cost broken out
The only number that exposes the wastecost per hour, ranked across the fleet — where the money hides
One machine's fuel record is interesting. The whole fleet's records, lined up and ranked by true cost per hour, are where the savings live. That's the view that turns a vague "our fuel costs too much" into a specific, fixable list — the conversation that pays for the whole program.
That ranking is what a fuel spreadsheet can never give you, because the fuel lives in one file and the maintenance in another. HVI rolls them together in cost analytics per asset, so the worst performers surface on their own. Start a free trial and rank your own machines by real cost per hour
From scattered data to one cost per assethow HVI builds a real operating cost picture instead of a fuel total
The reason mining fuel cost is hard to control isn't missing data — it's scattered data. Fuel is on the card system, repairs are in a binder, hours are in the operator log. Cost control starts when all of it rolls up to the same machine.
-
1
Capture fuel against the asset
Fuel is logged per machine — by entry, fuel-card integration, or storage draw — so every gallon has a truck's name on it, not just a fleet total.
-
2
Log hours & usage
Operating hours and daily usage come in from operator reports or telematics, giving fuel a denominator — the per-hour and per-shift figures that make machines comparable.
-
3
Roll in parts & labor
Every work order links its parts and labor cost to the same asset, so fuel isn't measured alone — it sits beside the true cost of keeping that machine running.
-
4
Add downtime & idle
Downtime events and idle patterns attach to the record, so the hidden costs — the idling burn, the lost production — are finally part of the number instead of invisible.
-
5
Rank, compare, decide
The dashboard shows cost per hour per machine, trended and ranked — the number you take into a budget, a replace-or-repair call, or an operator coaching conversation.
That single rolled-up number is the one spreadsheets can't produce and the one every cost decision needs. Book a demo to see fuel, parts, labor, and downtime on one asset record
The mining fuel cost-control checklistwhat a fleet that actually controls fuel cost tracks — and most don't
Run your own operation against this. Every box a tracked system ticks is a box a fuel-card-and-spreadsheet setup leaves blank — and each blank is money you're spending without seeing.
Can't tick most of these? The fuel money is leaking somewhere you can't currently see — which is exactly what the tracking is for. Book a demo and see the whole cost picture on one screen
From a mine operations manager who found the leak
For years our fuel number was just a line I reported and winced at. I knew it was high, I couldn't tell you why. The breakthrough wasn't some big efficiency project — it was finally seeing fuel per truck next to that truck's hours and its maintenance.
Two trucks jumped out immediately. One had a chronic idle problem at crew change; the other was overdue on air filters and burning for it. Neither was a secret — they were just hidden inside a fleet average. We fixed the idle policy and the filters, and the trend bent down within two months. The software didn't save the fuel. Seeing the number did.
What fuel cost visibility pays backthe ROI math on seeing your mining fuel cost per machine
Frequently asked questions
What is mining fuel cost tracking software?
It records fuel against each machine and ties it to hours, parts, labor, and downtime, so you see true cost per asset instead of one fleet-wide invoice total. HVI rolls it all into per-machine cost analytics. Book a demo to see it on your fleet.
How much of mining cost is fuel?
Diesel typically accounts for 30–50% of transportation cost in open-pit mining, making it one of the largest controllable line items. That's why seeing it per machine, not per fleet, matters so much. Book a demo to break yours down.
How much can fuel cost tracking actually save?
Idle reduction plus better load and route discipline typically cuts total fuel use 15–25%, and a single idling haul truck can cost $300+ an hour. The savings start the moment the waste is visible per asset. See the numbers in a demo.
Why not just use the fuel card reports?
Fuel-card totals show what the fleet burned, not cost per hour per machine, and they don't connect to maintenance. HVI ties fuel to hours and repair history so a rising cost points at a fixable cause. Book a demo to compare.
Does it work across haul trucks, shovels, and loaders?
Yes. Cost per hour is tracked for every asset class, so you can compare and rank a mixed fleet and spot the outliers draining the budget. Start a free trial or book a demo to see your fleet ranked.
See exactly where your mining fuel money goes
HVI logs fuel against every asset, rolls in parts, labor, and downtime, ranks your fleet by real cost per hour, and ties rising fuel burn to the maintenance that fixes it. The monthly mystery becomes a short list of machines, operators, and habits to act on — and the savings follow the visibility. Live in under two weeks.
- Fuel logged per machine
- Fuel + parts + labor + downtime, rolled up
- Cost per hour, ranked across the fleet
- Exportable reports for budgeting