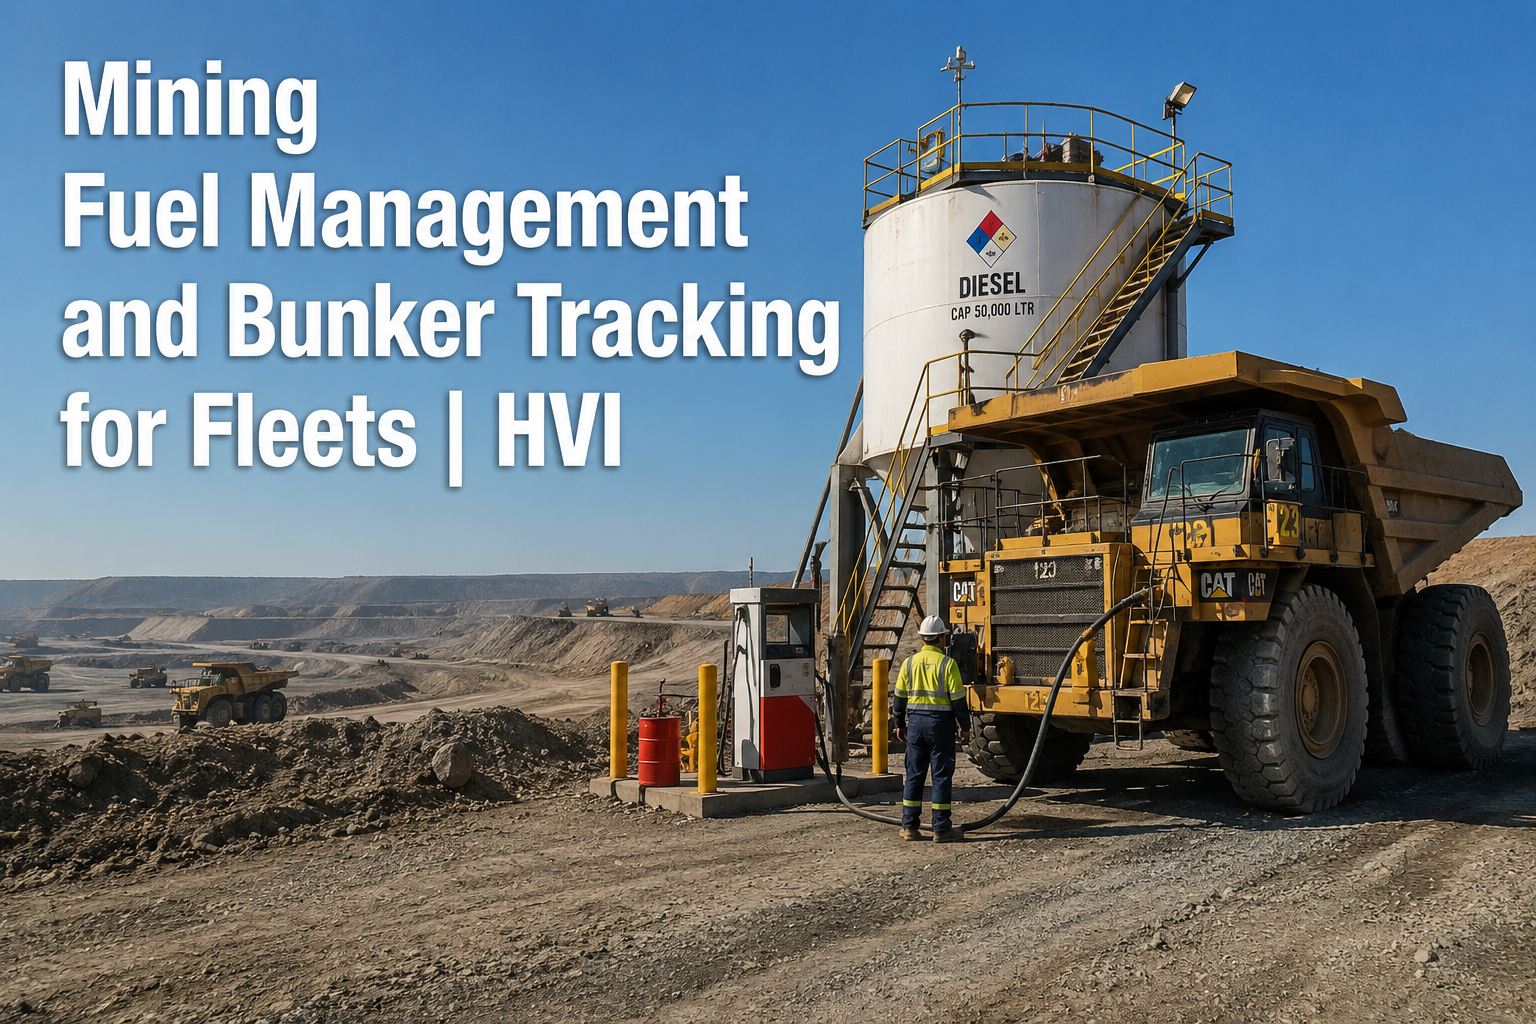
Every mine manager knows the fuel bill is enormous, but very few can tell you which machine burned it. A 40-truck haul fleet can easily move 100,000 litres of diesel in a week, and if the only number you track is the bulk delivery ticket, you are flying blind. Mining fuel management is not about counting litres at the gate; it is about knowing, per machine, per shift, where every litre went and what it tells you about the health of that unit. When a Cat 777 starts burning 8% more than its class average, that is not an operator problem - it is a turbo, an injector, or an air filter telling you something is wrong. The gap between what gets delivered to your bunker and what actually ends up in machine tanks is where money disappears. If you want to see how to close that gap on your own site, book a 30-minute walkthrough and we will show you the reconciliation view on your own fleet data.
Fuel is your biggest controllable cost. Why is it your least instrumented?
Most mines reconcile fuel at the storage tank, not at the machine. That hides waste, theft, and developing mechanical faults in a single bulk number. Per-machine consumption benchmarking changes the conversation from "we used a lot of diesel" to "Unit 14 is burning 12% above class norm - pull it in for a compression test."
The real cost of poor mine fuel consumption tracking
These are not industry averages for the sake of a slide. Each one maps to a line item you can attack this quarter if you have per-machine data instead of a bulk delivery figure.
Annual fuel spend for a 20-truck fleet
A single rigid haul truck burns 30,000-60,000 litres a year depending on cycle and payload. At current diesel prices, a mid-size fleet is a seven-figure fuel operation. A 5% improvement is not a rounding error - it is a new service truck.
Burn variance between identical trucks
Two same-model trucks on the same circuit can differ by double digits. That gap is almost never operator behaviour alone; it is usually a developing fault - low compression, dragging brakes, or a blocked aftercooler.
Of idle time is recoverable
Telematics data across mining fleets consistently shows idle fuel waste as the single largest recoverable loss. A truck idling 4 hours a shift at 3-4 litres per hour is burning $15-20 of diesel to produce nothing.
From anomaly to work order
Without per-machine fuel data, a sick engine gets discovered at the next PM or on the side of the haul road. With it, you can flag the anomaly, raise a work order, and have the truck in the shop before the weekend.
How to close the gap between delivery, dispensing and machine consumption
The reconciliation gap is where fuel management lives or dies. If you cannot account for the difference between what the tanker dropped and what your machines actually burned, you do not have a fuel problem - you have a data problem.
Delivery and intake
Record every bulk delivery against the bunker or tank it went into, with temperature-corrected volume and a dip reading before and after. This is your baseline. Without it, every downstream number is guesswork.
Dispensing control
Every litre out of the tank gets tagged to a machine, an operator, and a timestamp. Manual logs fail here; a fuel card or telematics-integrated dispensing system does not. This is where theft and leakage get caught.
Machine consumption
Compare what was dispensed to a machine against its engine hours and fuel burn rate. A truck that took 400 litres but only shows 320 litres of burn has 80 litres unaccounted for. That is your gap.
Worked example: A 30-truck fleet takes delivery of 180,000 litres in a month. Dispensing records show 176,400 litres issued. Machine burn data shows 171,200 litres consumed. The 5,200-litre gap is 2.9% - worth roughly $7,000-9,000 at bulk diesel prices. That is a leaking tank fitting, a meter calibration issue, or someone filling a private vehicle. You cannot fix what you cannot see.
Why idle fuel waste is your biggest recoverable loss - and how to read it correctly
Raw litres per hour is a useless metric without context. A truck burning 45 L/h on a short, steep cycle with full payload is healthy. The same number on a long flat run with half loads is a problem. You need load and cycle data to make consumption figures meaningful.
The idle problem
A 100-tonne haul truck idles at 3-5 litres per hour. Across a 20-truck fleet running two 12-hour shifts, 25% idle time means roughly 1,800-3,000 litres a day producing zero tonnes moved. That is $2,500-4,000 daily, or $75,000-120,000 a month, spent on engine wear and nothing else.
The context problem
Litres per hour only becomes actionable when you layer in payload, cycle time, and haul distance. A truck showing high burn on a long uphill haul is normal. The same truck showing high burn on a short flat cycle is telling you to check the injectors or the air system.
The benchmarking fix
Group machines by class and circuit, then flag any unit burning more than one standard deviation above its peers. That is your maintenance shortlist. It turns fuel data from a cost report into a predictive tool.
Fuel tracking that connects to your maintenance workflow
HVI is not a standalone fuel app. It is a CMMS that treats fuel data as a maintenance trigger, not just a cost line. Here is how the pieces fit together on a mine site.
Fuel Logs and Storage
Record consumption, intake and storage per machine and per bunker. HVI tracks the full chain from delivery ticket to machine tank, so your reconciliation gap is visible in real time, not at month-end.
Fuel card and telematics integration
Pull dispensing data from your fuel card provider and engine hours plus idle data from your telematics feed. No manual entry, no transcription errors, no 400-litre fills logged against the wrong unit.
Consumption benchmarking
HVI Analytics groups machines by class and flags outliers automatically. When Unit 22 starts burning 10% above its peer group, you get an alert, not a surprise at the next service.
Defect-to-work-order flow
A fuel anomaly becomes a work order with one tap. The technician sees the burn trend, the idle data, and the machine history in one screen. Diagnosis starts before the truck hits the shop.
Fuel theft prevention on a mine site starts with dispensing control
Most fuel theft is not a midnight raid on the tank. It is a slow bleed: a ute filled here, a drum topped up there, a meter that reads 2% slow. Dispensing control closes those holes by making every litre accountable.
| Control point | What goes wrong without it | What HVI records |
|---|---|---|
| Bulk delivery | Short deliveries, temperature-corrected volume disputes, no baseline for reconciliation | Delivery ticket, tank dip before/after, corrected volume, supplier and timestamp |
| Dispensing event | Fuel issued to wrong machine, unlogged fills, manual entry errors, unauthorised use | Machine ID, operator ID, volume, timestamp, odometer or engine hours at fill |
| Machine burn | No way to verify dispensed fuel was actually consumed by that unit | Telematics burn rate, idle hours, load factor, calculated vs actual consumption |
| Reconciliation | Month-end surprise, no audit trail, inability to isolate where the gap occurred | Automated variance report by tank, by machine, by shift, with drill-down to individual events |
If your current system is a clipboard at the bowser and a spreadsheet at month-end, you are relying on memory and honesty. Both fail. See how the reconciliation view works on a live demo with your own fleet structure.
Stop managing fuel as a bulk number
Per-machine consumption benchmarking turns your fuel bill from a cost centre into a maintenance early-warning system. See it running on your own units.
How to roll out per-machine fuel tracking without stopping production
The biggest objection to better fuel management is not cost - it is the fear of a six-month IT project. A practical rollout takes weeks, not quarters, and starts delivering data in the first month.
Baseline and bunker setup
Map your storage tanks, bowsers and dispensing points. Load your machine list into HVI with class groupings. Start recording deliveries and dips. You are not changing behaviour yet - just capturing the current state.
Dispensing control live
Connect your fuel card or dispensing system. Every fill now tags a machine and operator. The first reconciliation report will show you the gap you suspected but could not prove.
Telematics and benchmarking
Pull engine hours and idle data from your telematics provider. HVI Analytics starts flagging outliers. Your first fuel-triggered work order usually happens in this window.
Refine and expand
Add load and cycle context from your fleet management system. Tune idle thresholds by circuit. Extend the same tracking to gensets, lighting plants and support equipment.
The key is that none of this requires new hardware on day one. If you have a fuel card and a telematics feed, you have the data. HVI just makes it usable. Start logging fuel free and see the first reconciliation report within a fortnight.
What to do with your fuel data on Monday morning
Reconcile weekly, not monthly
A 2% gap found in a week is a calibration issue. The same gap found at month-end is a write-off. Shorten the cycle and the problem gets smaller.
Benchmark by class and circuit
A truck on a short steep haul will always burn more than one on a long flat run. Compare like with like, or you will chase ghosts and miss real faults.
Treat idle as a maintenance issue
High idle is often a symptom - a faulty thermostat, a driver keeping the cab warm because the heater is broken, or a hydraulic leak that makes shutdown risky. Fix the cause, not just the behaviour.
Let fuel data trigger work orders
The goal is not a prettier fuel report. It is a truck in the shop before the turbo fails on the haul road. If your fuel data does not create maintenance actions, it is just accounting.
Mining fuel management is not about buying a bigger spreadsheet. It is about closing the loop between what you buy, what you dispense, and what your machines actually burn - then using that data to keep trucks running and costs down. Book a demo and we will show you the full workflow on your own fleet structure.
"I used to get the fuel report on the 5th of the month and by then whatever happened was ancient history. Now I get an alert when a truck burns 8% above its mates, and I can have it in the shop the same week. Last quarter we caught a set of injectors on a 785 before they let go completely. That one save paid for the system for the year."
Mining fuel management FAQs
What is a normal fuel reconciliation gap on a mine site?
A well-controlled site should hold the gap between deliveries, dispensing and machine consumption under 1%. Between 1% and 3% suggests meter calibration issues, temperature correction errors, or minor unlogged usage. Above 3% you are looking at leakage, theft, or a serious data capture problem. The only way to know is to track all three legs of the chain - intake, dispensing and burn - and reconcile them weekly.
How do I know if high fuel burn is an operator problem or a mechanical fault?
Compare the machine to its class peers on the same circuit. If one truck is 8-12% above identical units on the same haul profile, that is almost never operator behaviour alone. Check for low compression, injector balance rates, boost pressure, and brake drag. HVI flags these outliers automatically so you can raise a work order before the fault becomes a failure. See the benchmarking view in a demo.
Can I track fuel without installing new hardware on every machine?
Yes. If you already have a fuel card system and a telematics feed, HVI can integrate both and start building per-machine consumption profiles without new sensors. The fuel card tells you what was dispensed; the telematics tells you engine hours and idle time. That is enough to benchmark and flag anomalies. You can add flow meters or CAN bus feeds later if you want finer resolution.
What is the biggest single source of recoverable fuel waste?
Idle time. Across mining fleets, telematics data consistently shows 15-25% of total fuel burn at idle, and 30-50% of that is recoverable with better shift change practices, automatic shutdown timers, and fixing the underlying reasons operators leave engines running. A 20-truck fleet cutting idle by 5 percentage points can save $50,000-80,000 a year in fuel alone, before you count reduced engine wear.
How does fuel data connect to preventive maintenance?
Fuel consumption is a leading indicator of engine health. A gradual rise in burn rate often precedes a fault code or a failure by weeks. In HVI, a fuel anomaly can trigger a work order automatically, and the technician sees the consumption trend alongside the machine's service history. That turns your fuel report from a cost summary into a predictive maintenance tool. Sign up free and connect your first data source this week.
Your fuel data is already telling you which trucks are sick
You just need a system that listens. HVI connects fuel logs, dispensing records, telematics and work orders in one platform built for heavy fleets.
Free to start - Works on any phone - No card needed