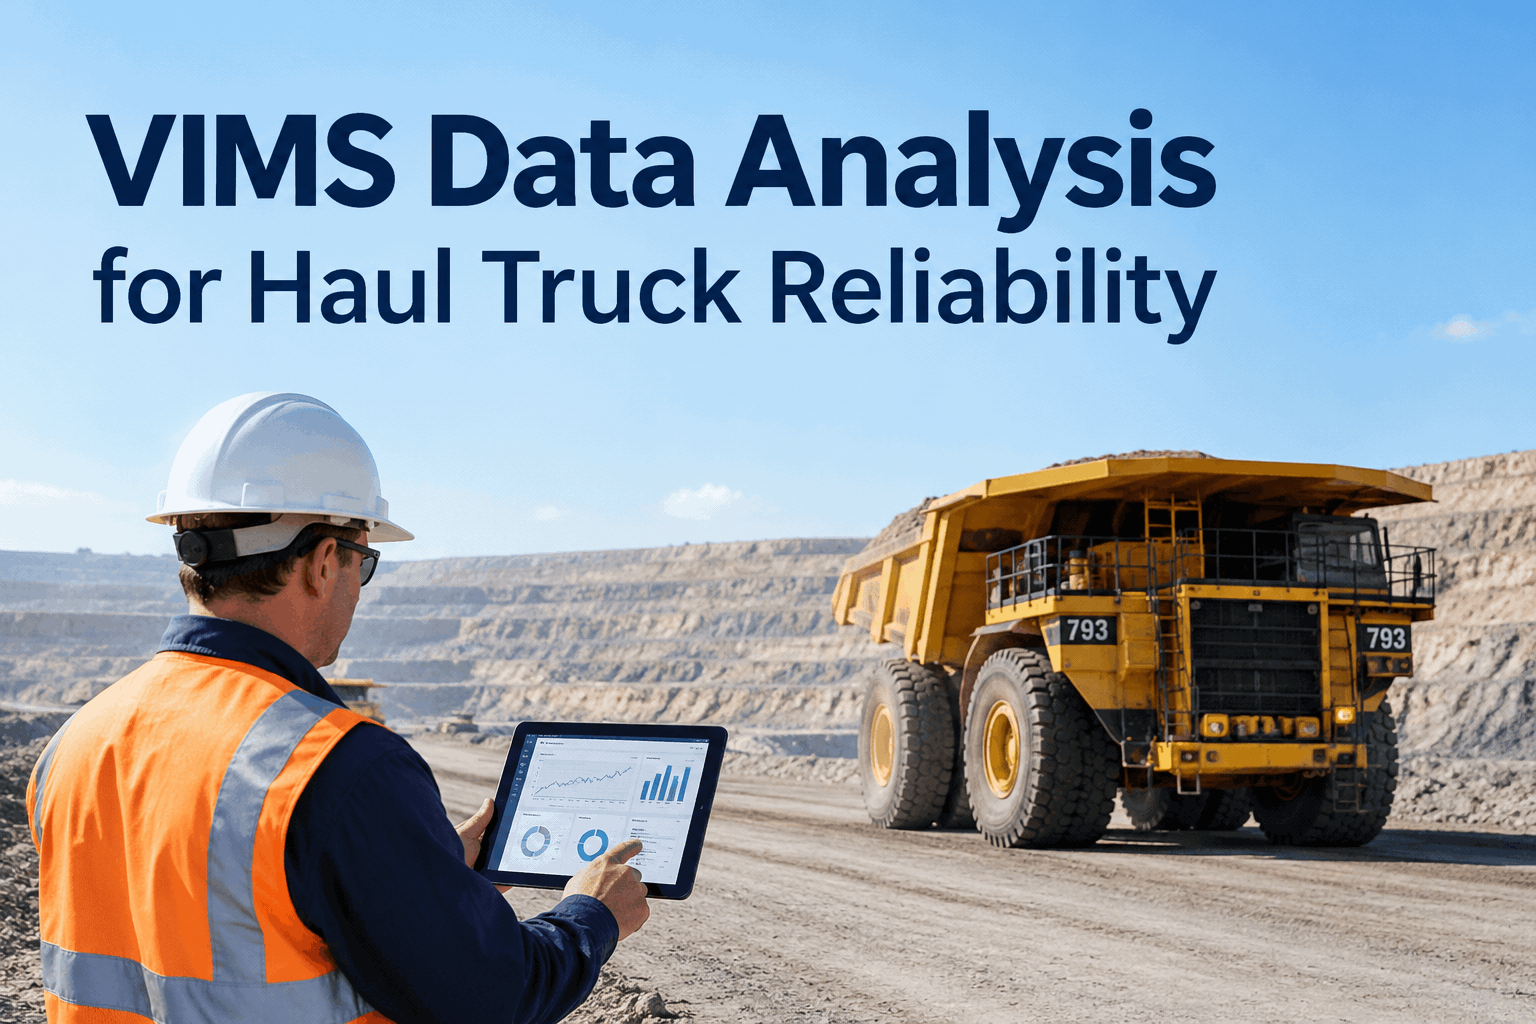
Any maintenance manager running a fleet of Cat haul trucks knows VIMS is sitting on every unit, logging everything — payload, engine load, oil temps, brake pressures, the abuse events an operator would never write up. The data's there. The problem is rarely the data; it's that VIMS data analysis ends at a screen full of trends, and a trend nobody acts on is just a prettier version of a surprise breakdown. The value isn't in seeing the drift. It's in what happens next. Book a demo to see VIMS insight turn into action.
VIMS Data Analysis That Actually Improves Haul Truck Reliability
VIMS tells you what the truck is doing. It doesn't open the work order, schedule the inspection, or track whether the fix happened. HVI is the layer that turns a VIMS trend into a closed maintenance loop.
For a mining maintenance manager, the frustration with VIMS data analysis isn't a shortage of information — it's the opposite. There's so much of it that the signals that matter get buried, and the ones that do get noticed often die in an email instead of becoming a scheduled job. Fixing haul truck reliability starts with being honest about what VIMS does and doesn't do.
What VIMS data analysis tells you — and what it leaves undone
Caterpillar's Vital Information Management System is a genuinely good onboard monitor. It captures the parameters and events that shape a haul truck's life. But monitoring and maintaining are two different jobs, and VIMS only does the first one. Here's the honest split.
- Engine, powertrain, and hydraulic parameters in real time
- Payload and overload / abuse events as they happen
- Trends and exceedances against Cat's thresholds
- Event logs that point to how a truck is being run
- Turn a flagged trend into a work order
- Tie the signal to the operator's inspection and defect history
- Track parts, labor, and cost against that repair
- Prove the fix happened and the trend reversed
VIMS is a Caterpillar product. HVI does not replace it or read its raw telemetry as a monitoring system — HVI is the maintenance system where a VIMS-flagged issue becomes a tracked, closed-out action. Parameter names and thresholds vary by truck model and configuration.
That right-hand column is exactly where reliability is won or lost. A trend you can see but can't act on reliably is a breakdown waiting its turn. Book a demo to see the flag-to-fix workflow.
Reading a VIMS trend before it becomes a failure
The point of VIMS data analysis is lead time. A parameter rarely jumps straight to failure — it drifts, crosses a caution band, and only then fails. The window between the first drift and the breakdown is where a planned repair replaces an unplanned one. The trick is catching the drift and acting while it's still cheap.
Spotting the drift is step one; the reliability gain only lands if that drift becomes a scheduled inspection or repair inside that window. When your maintenance analytics and your VIMS trends live in the same place, the window stops getting missed. Book a demo to see trend-to-schedule in action.
The reliability picture VIMS can't see on its own
VIMS is powerful, but it only knows what its sensors measure. A haul truck's real reliability story also includes things that never touch a VIMS channel — and those are exactly the pieces HVI adds. Put together, you get the full picture instead of half of it.
Operator-reported defects
The noise, the leak, the soft brake pedal — things a driver feels that no sensor logs, captured in the pre-shift inspection.
Full repair & parts history
What's been replaced, when, and how often — the recurrence pattern that turns a one-off into a known problem.
Cost per unit, over time
Which trucks are quietly eating the budget — the reliability signal that only shows up when you track dollars, not just data.
Overlay VIMS parameter trends on inspections, repair recurrence, and cost, and a truck's reliability stops being a guess. That combined view is what HVI's maintenance management is built to give a mining fleet. Sign up free and build the full picture.
Turning VIMS data analysis into haul truck reliability: a checklist
If your VIMS data is generating trends but not fewer breakdowns, the gap is almost always in the workflow after the flag. Run through these — each one is a place a good signal usually gets lost.
Clear all five and VIMS data analysis stops being a dashboard you glance at and becomes the engine of a measurably more reliable haul fleet. That's the workflow HVI is built around, and it works alongside your existing Caterpillar monitoring setup. Book a demo to map it to your fleet.
From a maintenance manager who stopped drowning in VIMS data
We had VIMS data coming out of our ears and our availability wasn't moving. The trucks were telling us everything — we just weren't doing anything with it fast enough. What changed wasn't better data, it was closing the gap between a trend showing up and someone actually scheduling the work. Now a rising oil temp on a 793 becomes a job on the board the same day, tied to that truck's history, and I can see whether the fix held. The VIMS screen was never the problem. What we did after looking at it was.
VIMS data analysis FAQs
Does HVI replace VIMS or read raw VIMS telemetry?
What is VIMS data analysis actually for?
How does HVI improve haul truck reliability beyond VIMS?
Do I need Caterpillar equipment to use HVI?
Can VIMS trends and inspections live in one system?
Make VIMS data analysis the start of the fix, not the end of the report
Your Cat haul trucks are already telling you what they need. HVI turns that VIMS data analysis into tracked work orders, schedules the repair inside the window, and proves the trend reversed — alongside the inspections, parts, and cost history VIMS never sees. See it on your fleet.
No credit card · Works alongside VIMS · Any OEM, any mixed fleet
- VIMS trend → tracked work order
- Signals beside full repair history
- Operator defects VIMS can't see
- Cost per truck & failure mode
- Works alongside VIMS, any OEM