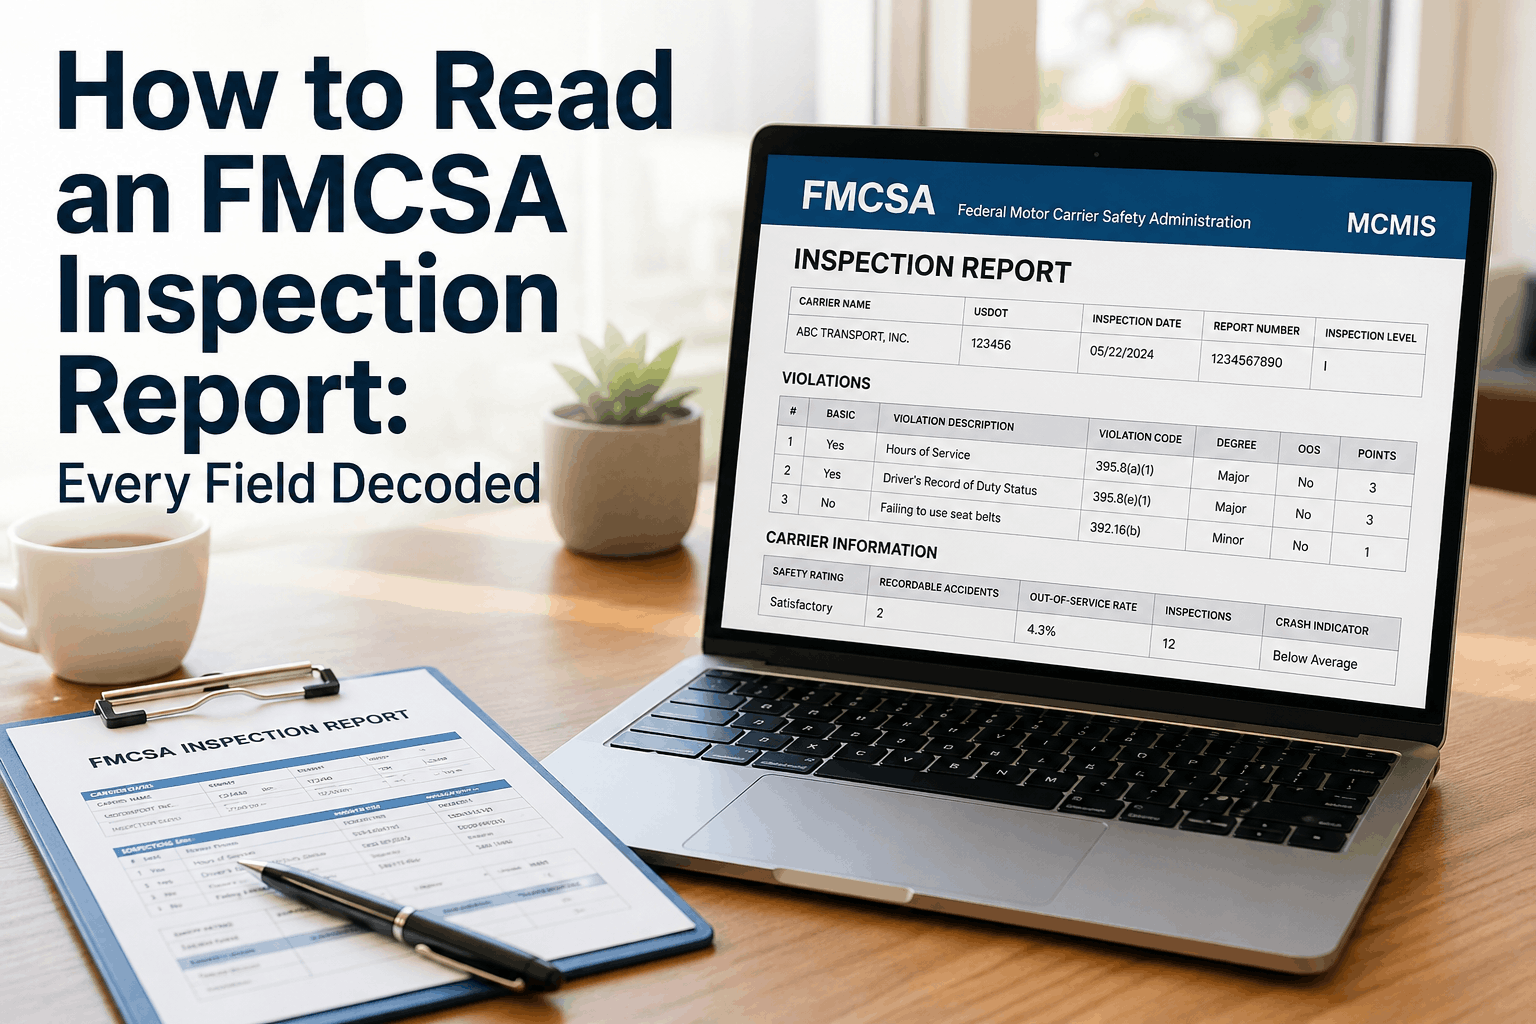
The FMCSA inspection report that lands in a safety manager's inbox the day after a roadside stop looks like a dense administrative form. It is not. Every field on the Driver/Vehicle Examination Report (DVER) feeds the Motor Carrier Management Information System (MCMIS), which feeds the Safety Measurement System (SMS), which determines whether your fleet gets a warning letter, a focused compliance review, or a full audit in the next 24 months. Reading the report correctly is the difference between a safety manager who can predict their next SMS update and one who is surprised by it. The fields look bureaucratic but each one carries weight: the inspection level (1 through 6) determines what was actually checked, the violation codes link to specific 49 CFR sections with assigned severity weights of 1 to 10, the OOS flag adds a 2-point bonus that compounds in your Vehicle Maintenance BASIC, and the time-decay schedule (3x in the first 6 months, 2x at 6–12 months, 1x at 12–24 months) determines exactly how long each violation hurts you. Public-facing data on SAFER tells one story; the internal SMS score behind your carrier login tells another. The 2026 CSA overhaul changed several of these mechanics — Crash Indicator removed from public scoring, the new Vehicle Maintenance: Driver Observed category added, utilization factor raised to 250,000 VMT per power unit, intervention thresholds adjusted. This guide decodes every field on a current FMCSA inspection report, the severity-and-decay math behind the scoring, and the difference between what the public sees and what FMCSA actually uses. HVI's inspection & maintenance software imports MCMIS data automatically and surfaces the trend that the field-by-field reading is trying to find.
Read the Report. Understand the Score. Predict the Intervention.
HVI pulls MCMIS inspection data into one dashboard, maps each violation code to its severity weight and time multiplier, and surfaces the BASIC-level trend before FMCSA's next monthly SMS update. Read your own data the way FMCSA reads it.
What the Report Actually Is — DVER → MCMIS → SMS
The inspection report is a single document that becomes three different records. Knowing which one you are looking at determines what you can do with it.
DVER
Driver/Vehicle Examination Report
The physical (or electronic) form the inspector hands the driver. Same data, raw form. Driver carries one copy; one goes to the state.
MCMIS
Motor Carrier Management Information System
FMCSA's central database. State agency uploads the DVER, MCMIS associates it with your USDOT number, and the violations attach to your carrier profile + the driver's PSP.
SMS
Safety Measurement System
Monthly calculation. Pulls 24 months of MCMIS data, applies severity weights and time multipliers, produces your percentile rank per BASIC category — the number that triggers FMCSA intervention.
The 6 Inspection Levels — What Each One Actually Covers
The "Level" field at the top of the report tells you what was inspected. Levels 1, 2, and 3 cover most roadside stops. Levels 4–6 are specialized. Knowing the level explains what the report covers (and what it does not).
1
North American Standard (Full)
The 37-step comprehensive inspection. Driver credentials + full vehicle walk-around including under-truck brake measurement. The benchmark inspection level.
2
Walk-Around Driver/Vehicle
Same as Level 1 but no under-vehicle inspection. Inspector checks driver credentials and what is visible without crawling.
3
Driver-Only
CDL, medical card, HOS / ELD, drug-and-alcohol documents, paperwork. No vehicle inspection at all.
4
Special Study
One-time inspection for research or data collection. Usually focused on a single component or compliance issue. Rare.
5
Vehicle-Only (No Driver)
Same vehicle inspection as Level 1 but conducted without the driver present — typically at the terminal or shipper.
6
Enhanced Radioactive / HM
Specialized inspection for vehicles transporting radioactive materials or sensitive hazmat. Extensive paperwork and security checks.
Every Field on the Report — Decoded
The header of every inspection report carries 15–20 fields that go straight into MCMIS. Here is what each one means and which ones matter most for your downstream SMS calculation.
Field
What It Is
Why It Matters
USDOT Number
Your federal carrier ID
Routes the inspection to your carrier profile in MCMIS
MC / MX Number
Operating authority number
Confirms interstate operating authority is active
Report Number
Unique inspection identifier
Reference for DataQs challenges
Inspection Date / Time
Calendar timestamp
Drives the time-decay multiplier (3x / 2x / 1x)
State / Location
Inspection jurisdiction
Determines which state agency entered the record
Inspector ID / Badge
Officer credential
Required for DataQs disputes
Inspection Level
Level 1 through 6
Determines scope of what was actually checked
Vehicle ID (VIN)
17-character vehicle identifier
Links violations to specific unit in your fleet
Driver CDL + License #
Driver credentials
Routes driver violations to PSP record
Violation Code(s)
49 CFR section + sub-citation
Each code has an assigned severity weight 1–10
OOS Indicator
Y/N flag per violation
OOS adds +2 to severity weight — the biggest swing factor
Hazmat Indicator
Y/N if hazmat transported
Routes HM violations to separate scoring
Citation Issued
Whether a fine was written
Note: violations score in SMS even WITHOUT a citation
The single most useful field for predicting your next SMS update: the OOS Indicator on each violation. OOS adds +2 to the severity weight, which after 3x recency multiplier compounds the most.
Start free with HVI.
Violation Codes — The 49 CFR Numbering System
Every violation code on the report ties to a specific 49 CFR section. The numbering is consistent and learnable. Recognize the prefix and you know which BASIC the violation feeds.
392.x
Driving of CMVs
Unsafe Driving + HOS
Speeding, reckless driving, ill driver, mobile phone use, pre-trip duty
393.x
Parts & Accessories Necessary for Safe Operation
Vehicle Maintenance
Brakes, tires, lights, steering, suspension, coupling, cargo securement
395.x
Hours of Service of Drivers
HOS Compliance
11-hour driving limit, 14-hour duty, 30-min break, ELD use, log falsification
396.x
Inspection, Repair, Maintenance
Vehicle Maintenance + Driver Observed
DVIR missing, signatures, annual inspection, 3-signature chain failures
383.x / 391.x
CDL Standards / Driver Qualifications
Driver Fitness
Invalid CDL, missing medical cert, disqualified driver, MVR issues
382.x
Controlled Substances & Alcohol
Controlled Substances
Failed testing, Clearinghouse violations, refusal to test
177.x / 397.x
Hazardous Materials
HM Compliance
Placarding, shipping papers, packaging, routing, security plans
How Severity Weight + Time Decay Become Your CSA Score
This is the math that converts a roadside violation into a percentile rank that determines whether FMCSA pays attention to your fleet. Two multipliers compound — severity and time. Understanding them turns the inspection report from a record into a forecast.
SEVERITY WEIGHT
Assigned per violation code, 1 to 10
Each violation in MCMIS has a fixed severity weight reflecting its crash-correlation strength. Minor violations score 1–3, moderate 4–6, severe 7–10. OOS violations get an automatic +2 bonus weight — the single largest factor in why a Level 1 inspection finding hits harder than a Level 3 paperwork issue.
TIME MULTIPLIER
Decays with violation age
0–6 months: 3x · 6–12 months: 2x · 12–24 months: 1x · After 24 months: removed from calculation. A violation hits your score hardest in the first 6 months — a fresh OOS finding can multiply 12x harder than a similar finding 13 months old.
WORKED EXAMPLE
A tire tread depth violation (severity 4) marked OOS (+2 = 6) found 3 months ago (3x multiplier) contributes 18 points to your Vehicle Maintenance BASIC measure. The same violation 14 months later contributes only 6 points. After 24 months, it contributes zero. The time decay is why a single bad quarter does not define a fleet — and why a fresh OOS is the most urgent item on any report.
The Time-Decay Schedule Visualized
The recency multiplier is what makes inspection reports a moving picture rather than a permanent record. Here is how a single violation's score changes over its 24-month lifespan.
Violation Age
Multiplier
Impact
What to Do
0–6 months
3x
Maximum CSA impact — this is when intervention thresholds get crossed
Immediate remediation + DataQs review if challengeable
6–12 months
2x
Still significant — visible in dashboards, drives insurance reviews
Track trend, document remediation, monitor for repeats
12–24 months
1x
Reduced weight, but still pulls in the calculation
Use as training material; verify no repeat patterns
After 24 months
0
Removed from SMS calculation entirely
No longer affects score — but remains in MCMIS history
Drop-off after 24 months is real, but the violation stays in MCMIS history — visible to insurers, shippers, and DataQs reviewers indefinitely. Score-impact ends; reputation impact does not.
Book a demo to see the time-weighted dashboard.
Public Profile vs Internal Score
The data anyone can pull on your carrier from SAFER is not the same as what FMCSA actually uses to decide whether to investigate you. Knowing the difference tells you which numbers to defend and which to actually act on.
PUBLIC PROFILE
SAFER Company Snapshot — anyone can see
Legal name + DBA
USDOT and MC/MX numbers
Operating authority status
Fleet size (power units, drivers)
Address + contact
Safety rating (if rated)
Out-of-Service rates (vehicle, driver, hazmat)
Crash totals (24 months)
Recent inspection summary
Used by: Shippers, brokers, insurance underwriters, attorneys
INTERNAL SMS SCORE
Behind carrier login at SAFER + ai.fmcsa.dot.gov
Per-BASIC percentile rank (0 = best, 100 = worst)
Intervention threshold flags per category
Individual violations with severity + time-weighted scores
Peer-group comparison (similar carriers)
Vehicle Maintenance + new "Driver Observed" split (2026)
Crash Indicator data (not publicly scored as of 2026)
Inspection-level breakdown (1-6)
DataQs status per disputed violation
Used by: FMCSA enforcement, your safety team, insurance reviewers with access
What Changed in 2026 — Read the Report Differently
The CSA overhaul effective 2026 changed several mechanics in how inspection reports translate into scores. If you are reading older guides, these are the differences.
NEW
Vehicle Maintenance: Driver Observed Category
Separate BASIC tracking defects a driver should have caught during walk-around. DVIR-quality violations now have their own scoring stream — meaning the same defect can hit two categories.
REMOVED
Crash Indicator from Public Display
Crash Indicator is no longer publicly scored as a BASIC. Crash data is still collected, still used in enforcement decisions, but not displayed in the public BASIC percentile ranks.
UPDATED
Utilization Factor to 250,000 VMT
Raised from earlier value for more accurate per-power-unit comparisons. Eliminates sudden score jumps when fleet size crosses utilization boundaries.
UPDATED
Intervention Threshold Adjustments
Vehicle Maintenance threshold raised from 80% to 90% in some categories based on revised crash correlation analysis. Unsafe Driving and HOS held at strict 65%.
Reading a Report: The 5-Minute Routine
The structured walk-through every safety manager should do the moment a new inspection report posts. Five minutes, every report, no exceptions.
1
Confirm USDOT and Vehicle. Verify the report is yours — wrong USDOT or wrong VIN is the most challengeable error via DataQs and the most common.
2
Note the Level. Level 1 means full vehicle + driver. Level 3 means driver only. This sets your expectation for what could appear in the violations.
3
Identify OOS Indicators. Scan the Y flags first. These get the +2 severity bonus and 3x recency multiplier — the violations that move the score the most.
4
Map Codes to BASICs. 392.x to Unsafe Driving, 393.x and 396.x to Vehicle Maintenance and Driver Observed, 395.x to HOS, 382.x to Controlled Substances. Know which BASIC is taking the hit.
5
Decide on DataQs. If any field is factually wrong — wrong vehicle, wrong driver, wrong citation interpretation — file a DataQs challenge with the report number and inspector ID within 60 days for the strongest case.
6
Route to Maintenance + Document Remediation. Every violation gets a work order, a closure date, and evidence. This is what an auditor wants to see 14 months from now: the violation closed, dated, documented.
The Report Is a Forecast, Not a Receipt
Every FMCSA inspection report is a forecast of what your next monthly SMS update will look like — the violation codes map to specific BASICs, the severity weights are fixed, the OOS indicators add the +2 bonus that compounds at the 3x recency multiplier, and the time-decay schedule (3x for 0–6 months, 2x for 6–12, 1x for 12–24, gone at 24+) tells you exactly when each violation stops hurting you. Safety managers who read reports as receipts wait for the score to surprise them. Safety managers who read reports as forecasts know within 5 minutes of a DVER posting exactly how much their Vehicle Maintenance percentile will move at the next update, which violations are DataQs-challengeable, and which need same-week remediation to limit damage. The 2026 CSA overhaul changed several mechanics — the new Driver Observed category, the removed Crash Indicator from public scoring, the raised utilization factor and thresholds — but the underlying math (severity weight times time multiplier, summed and normalized against peer carriers) is unchanged. The fields are decoded above; the math is on the page; the action sequence is the 5-minute routine. HVI's inspection & maintenance software pulls MCMIS data automatically, maps each violation code to its severity and current time multiplier, surfaces the per-BASIC trend before FMCSA's monthly recalculation, and tracks the DataQs status of every disputed violation. The result is that your internal view matches the SMS view — you stop being surprised by your own score. Start free today or book a 30-minute demo to see your MCMIS-mirrored dashboard live.
Read Your Own Data the Way FMCSA Reads It
MCMIS data import. Severity-weight + time-multiplier scoring per violation. BASIC-level trend forecasting. DataQs tracking. 2026 CSA framework. Trusted by 25,000+ users worldwide.
Frequently Asked Questions
Q: What is the difference between a DVER, MCMIS, and SMS?
DVER (Driver/Vehicle Examination Report) is the physical form the inspector hands the driver at roadside. MCMIS (Motor Carrier Management Information System) is the FMCSA database where the state agency uploads that DVER, associating it with your USDOT number. SMS (Safety Measurement System) is the monthly calculation that pulls 24 months of MCMIS data, applies severity weights and time multipliers, and produces your percentile rank per BASIC — the score that triggers FMCSA intervention.
Q: How are violation severity weights assigned?
Each violation code in MCMIS has a fixed severity weight from 1 to 10, reflecting its crash-correlation strength. Minor administrative violations score 1–3, moderate violations 4–6, and severe safety violations 7–10. Any violation marked Out-of-Service gets an automatic +2 bonus on top of the base weight — this is the single largest single-violation swing factor in your CSA score. The weights are documented in FMCSA's SMS Methodology PDF.
Start free with HVI.
Q: How long does a violation affect my CSA score?
24 months total, with declining weight: 3x multiplier in months 0–6 (maximum impact), 2x multiplier in months 6–12, 1x multiplier in months 12–24, then removed from the SMS calculation entirely after 24 months. The violation remains in MCMIS history indefinitely — visible to insurers, shippers, and DataQs reviewers — but stops contributing to the BASIC measure after the 24-month mark.
Q: Is the public SAFER profile the same as my internal SMS score?
No. The public SAFER Company Snapshot shows your legal name, USDOT, fleet size, operating authority, OOS rates, crash totals, and any official safety rating. Your internal SMS score (behind your carrier login at ai.fmcsa.dot.gov) shows the per-BASIC percentile ranks, individual violation scoring, peer-group comparison, intervention threshold flags, and DataQs status. Shippers and insurers see the public profile; FMCSA enforcement and your safety team see the internal score.
Book a demo.
Q: What changed in CSA scoring in 2026?
Four major changes. (1) New "Vehicle Maintenance: Driver Observed" BASIC tracks defects a driver should have caught during walk-around — same defect can now hit two categories. (2) Crash Indicator removed from publicly displayed BASIC percentiles (crash data still used in enforcement). (3) Utilization factor raised to 250,000 VMT per power unit for more accurate peer comparisons. (4) Some intervention thresholds adjusted (Vehicle Maintenance raised from 80% to 90% in certain categories; Unsafe Driving and HOS held at 65%).
Q: How do I challenge an incorrect inspection report?
File a DataQs Request for Data Review at dataqs.fmcsa.dot.gov within 60 days of the inspection for the strongest case. You need the report number, USDOT, inspector ID, and clear factual evidence (photos, repair records, work orders, witness statements). Wrong vehicle, wrong driver, factual misclassification of a defect, and citation reversal in state court are the most common winnable challenges. Document everything — the burden of proof is on you.
Start free today.