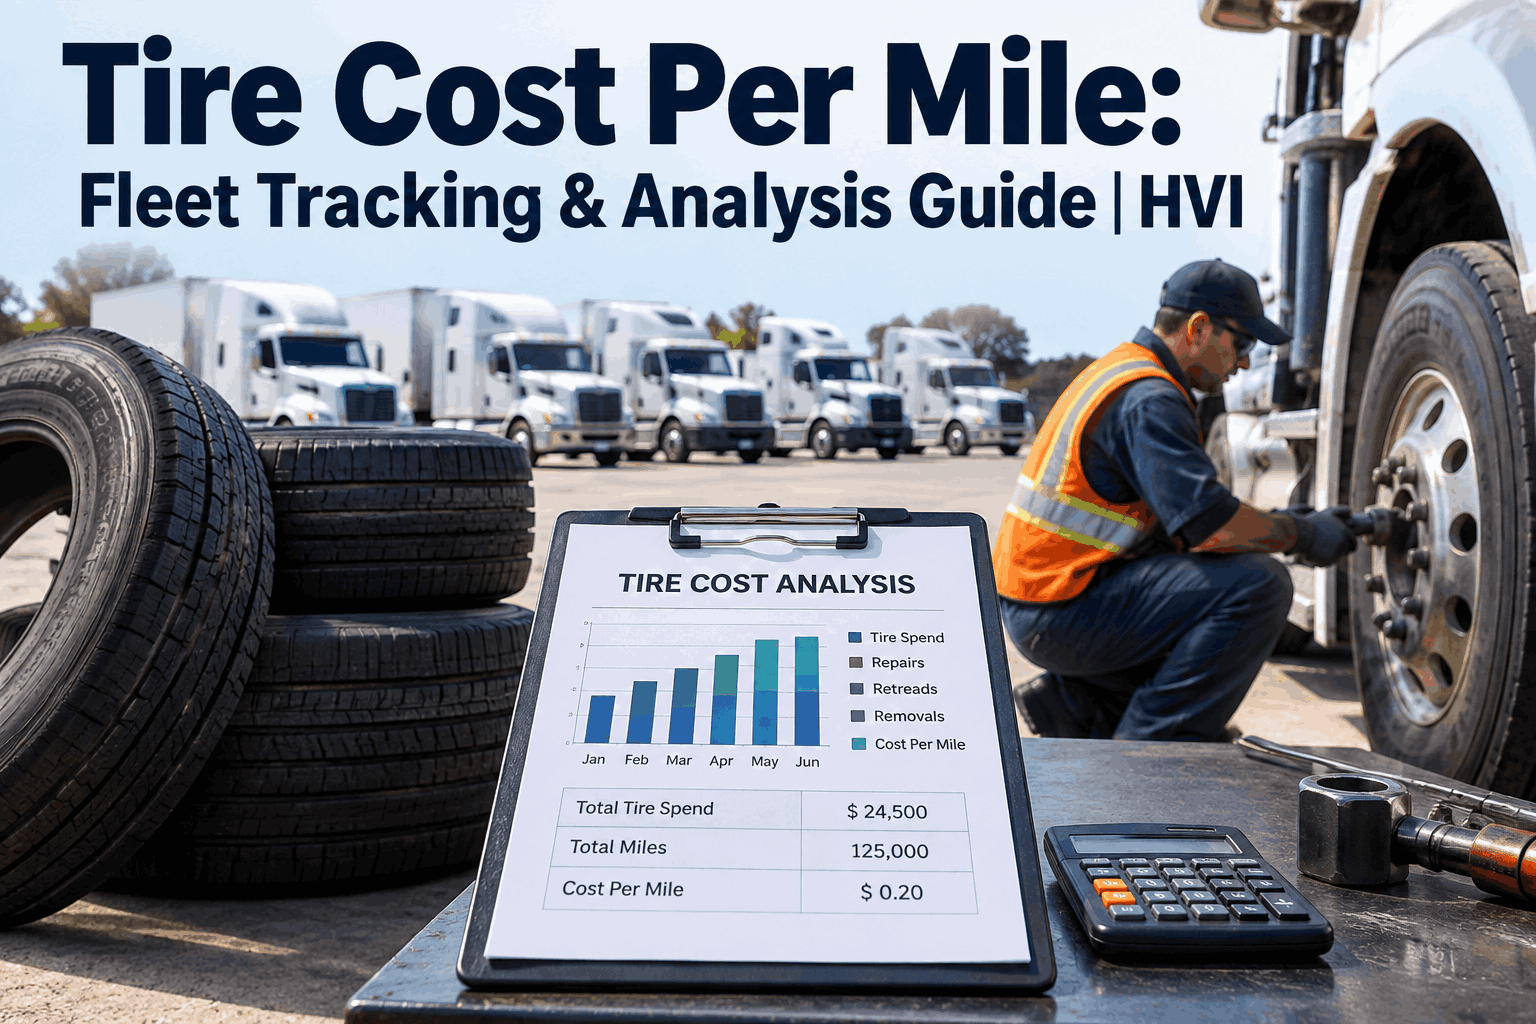
Ask a fleet manager their tire cost per mile and most can give you a number off the top of their head. Ask how they got it, and it usually falls apart — because the real figure is almost always higher than the one quoted from memory, often by 15 to 25 percent. Cost per mile is simple arithmetic: total tire cost divided by verified miles. The trouble is never the formula — it's the data feeding it: miles that aren't tracked install to removal, costs quietly left out, and a fleet average that hides where the money goes. This guide is about the data discipline that makes cost per mile real. Book a demo to see cost per mile built from tracked data.
Your Cost Per Mile Is Only as Good as Its Data
The formula is easy: cost divided by miles. The number most fleets quote is usually 15–25% too low — because the miles aren't verified, costs get left out, and a fleet average hides which position is really bleeding money. Fix the data and the number finally means something.
Cost per mile is the only honest way to compare tires: purchase price tells you what a tire costs, cost per mile tells you what it's worth. A cheap tire that pulls early and can't be retreaded is more expensive per mile than a premium one that runs long and takes two retreads. But that comparison only holds if the number is built on complete, verified data — which is exactly where most fleet CPM falls down.
Why the Number You Quote Is Usually Wrong
The gap between the quoted CPM and the real one isn't a math error — it's missing data. The formula divides cost by miles, and both sides of that fraction tend to be wrong in the same direction: costs understated, miles guessed.
Costs get left out
People remember the tire purchase and forget the rest — mounting and labor, roadside service, retreads, repairs. Every omitted cost flatters the number, which is why the true figure lands well above the one quoted from memory.
Miles get estimated
If you don't know how many miles a tire actually ran from install to removal, the denominator is a guess — and a generous one. Overstate the miles and the CPM drops artificially, making a mediocre tire look good.
Fix one side and you're still wrong; the number only becomes real when both the full cost and the verified mileage are captured for the actual tire. That's the whole game — not a cleverer formula, but honest inputs. For the formula and benchmark ranges themselves, HVI's cost-per-mile analysis in a demo lays out the math; this page is about getting the data underneath it right. Start free and capture the full cost of every tire.
The Costs That Get Left Out
A true cost per mile includes everything spent on the tire across its life, not just the sticker price. These are the buckets that get dropped — and each one that's missing pushes the quoted number below reality.
The new-tire price plus every retread on the casing. Each retread on a good casing spreads the original cost over more miles — but only if it's counted.
Mounting, balancing, rotation, alignment, and dismount labor. A frequently overlooked component — and one that flatters the number badly when omitted.
Tire-related road calls, plus the load delays and overtime they trigger. This is the line that separates fleets that count tires from fleets that count total tire cost.
The credit a good casing returns at end of life, subtracted from total cost. Ignore it and you overstate cost; capture it and the retread math works in your favor.
Add these up across the tire's whole life and divide by the miles it truly ran, and you get the real number — typically well above the one most managers carry in their head. The point isn't to make the number look worse; it's that you can't manage a cost you're systematically understating. Book a demo to see every tire cost captured against the asset.
The Input That Breaks It: Verified Mileage
Of the two numbers in the CPM fraction, mileage is the one fleets get most wrong — because it's the harder one to capture. Costs at least show up on invoices; miles-per-tire only exist if you track them from the day a tire goes on to the day it comes off.
Capture install & removal odometer
The miles a tire ran is the vehicle's mileage at removal minus its mileage at install. Miss either reading and the tire's true mileage — and its CPM — is unknowable.
Follow the tire through rotations
A tire moves positions and even trucks over its life. Its mileage has to follow it — not the wheel it happens to be on — or a rotated tire's real life is lost.
Use cost per hour where miles don't fit
For off-road, vocational, or equipment tires where miles mean little, track cost per hour instead — same discipline, a denominator that matches how the tire actually works.
This is why casual CPM is so unreliable: without tracked install-to-removal mileage that follows the tire through its rotations, the denominator is an estimate, and an estimate in the denominator makes the whole number soft. Verified mileage is the single input that turns CPM from a talking point into a metric you can act on. Start free and track mileage from install to removal.
Why Fleet-Average CPM Hides the Money
Even a perfectly calculated fleet-wide cost per mile is nearly useless for decisions, because it averages away the one thing you need to see: which positions are driving the cost. Steer, drive, and trailer tires live completely different lives.
Directional, high consequence
Steer tires carry directional and braking duty, often run new-only, and have the highest failure consequence. Their CPM behaves nothing like a free-rolling trailer tire.
Torque, deep tread, retreadable
Drive tires take drive torque and deep tread, and their casings often support multiple retreads — usually where the CPM math turns most favorable when managed well.
Free-rolling, lowest CPM
Trailer tires are free-rolling with the lowest failure severity, often retread-first from day one — typically the lowest cost per mile of the three positions.
Roll those three into one fleet average and you can't tell a well-run drive program from a bleeding steer position — the good and the bad cancel out into a middling number that points at nothing. CPM by position is where the number stops being a report and starts being a decision, showing exactly where optimization pays. Book a demo to see CPM broken out by position.
The Removal Record: Why the Tire Came Off
Here's a data point most fleets never capture and it changes everything: why a tire was removed. A tire pulled at its planned wear point tells a completely different cost story than one that failed early — even if the mileage looks similar.
Pulled for retread
A tire pulled at the right tread depth, casing intact, ready to retread — that tire delivered its full life and hands a valuable casing to its next life. Low, honest cost per mile.
Failed early / roadside
A tire pulled early from a road failure, irregular wear, or damage delivered fewer miles for the same or higher cost — and often forfeits the casing. Its true CPM is far worse than the average suggests.
Without the removal reason, both tires just look like "removed" and get averaged together, hiding the premature failures that are actually driving your cost. Capturing why every tire came off is what lets you separate the tires that did their job from the ones that cost you — and go find the alignment, road, or spec problem behind the early pulls. Start free and record a removal reason on every tire.
Casing Tracking Makes CPM Honest Over the Lifecycle
A commercial tire isn't one tire — it's a casing that may live several lives through retreading. Cost per mile only tells the truth when it's calculated across that whole lifecycle, not one tread at a time.
Track a casing by serial number and every retread spreads the original casing cost over more miles, dropping the effective CPM life after life. Miss the tracking — pull a casing too late, lose it to a preventable failure, or simply not record its generations — and you forfeit the retread economics that make the number work.
A casing that reaches two or three lives can cut cost per mile dramatically versus buying new every time, but only the fleets tracking casings by serial capture that; the ones that "just replace them when they wear out" don't. It's the same lifecycle discipline behind a solid tire and retread program in a demo — the casing data is what makes lifecycle CPM real rather than theoretical. Start free and track casings and retread generations by serial.
How HVI Builds a Cost Per Mile You Can Trust
Everything above comes down to one thing: the CPM is only as good as the data captured for each tire. Three capabilities turn scattered tire records into a number you can actually decide on.
Cost, mileage & removal by asset
Every tire's purchase, repair, retread, and service cost, its install-to-removal mileage, and its removal reason logged against the asset and wheel position — both sides of the CPM fraction, verified.
Position & casing tracking
Follow each tire through rotations and each casing through its retread generations by serial — so CPM is broken out by steer, drive, and trailer, and calculated across the full casing lifecycle.
Cost analytics & comparison
Compare CPM across brands, models, vendors, and applications on consistent data, and surface the recurring cost drivers — so purchasing and policy run on evidence, not the sticker price.
The result is a cost per mile you can defend in a budget meeting and act on in a purchasing decision: built from verified miles and complete costs, broken out by position, tracked across the casing lifecycle, and comparable across your options. That's the difference between a number you quote and a number you manage by. Book a demo to see it on your tire program. Start free and build a CPM you can trust.
From a tire manager who stopped guessing the number
For years I quoted a cost per mile I'd basically estimated — purchase price over rough miles — and felt good about it. When we actually tracked every cost and real install-to-removal mileage by position, the true number was almost 20% higher, and it was one trailer position dragging it up from premature pulls. That's not a number I'd have found in my head. Now the CPM is measured, by position, and I can defend the tire budget with data.
Frequently asked questions
How do you calculate tire cost per mile?
Cost per mile is total tire cost divided by the verified miles the tire delivered. Total cost includes the purchase price, retreads, mounting and service labor, repairs, and roadside events, minus the casing's scrap or credit value. Miles is the vehicle odometer at removal minus at installation, tracked as the tire moves through rotations. The formula is simple; the accuracy depends entirely on capturing every cost and the real mileage. A number built from the tire purchase alone and estimated miles is typically 15–25% below the true figure.
What costs should be included in tire cost per mile?
Everything spent on the tire over its life: the new-tire purchase, every retread, mounting, balancing, rotation, alignment and dismount labor, repairs, and tire-related roadside service and downtime — minus the casing value recovered at scrap. The commonly omitted buckets are labor and service, roadside and downtime, and casing credit, and leaving any of them out understates the number. A true CPM captures the full lifecycle cost, which is why it usually lands well above the figure fleets quote from the purchase price alone.
Why track tire cost per mile by wheel position?
Because steer, drive, and trailer tires have completely different cost-per-mile profiles, and a fleet-wide average hides that. Steer tires are usually new-only, directional, and high-consequence; drive tires take torque and often support multiple retreads; trailer tires are free-rolling and typically the lowest CPM, often retread-first. Averaging all three into one number cancels the good positions against the bad and points at nothing. Breaking CPM out by position shows exactly which axle is driving cost, where retreading is paying off, and where optimization effort has the biggest return.
Why does the reason a tire was removed matter for cost per mile?
Because a tire pulled at its planned wear point tells a very different cost story than one that failed early, and CPM alone can't distinguish them. A planned removal means the tire delivered its full life and left a retreadable casing; a premature removal from a road failure, irregular wear, or damage means fewer miles for the cost and often a forfeited casing. Without capturing the removal reason, both just look like "removed" and get averaged together, hiding the premature failures that are actually driving cost — and the alignment, road, or spec problems behind them.
How does retreading affect cost per mile?
Retreading lowers cost per mile by spreading the expensive casing over more miles. A quality casing can be retreaded two or three times, and each retread costs meaningfully less than a new tire while adding significant mileage, so the effective CPM drops with each life. But the savings only materialize if the casing is tracked by serial and pulled for retread at the right point — pull too late or lose the casing to a preventable failure and the retread economics are forfeit. Fleets that track casings and retread generations capture the lifecycle CPM benefit; those that replace tires as they wear out don't.
Turn Cost Per Mile Into a Number You Can Manage By
Capture every tire cost, install-to-removal mileage, removal reason, wheel position, and casing generation by asset — so your cost per mile is measured not remembered, broken out by position, honest across the casing lifecycle, and comparable across brands and vendors. The tires and positions driving cost finally show themselves. Live in under two weeks, trusted by 25,000+ users worldwide.
No credit card · No hardware · Tire cost analytics ready on day one