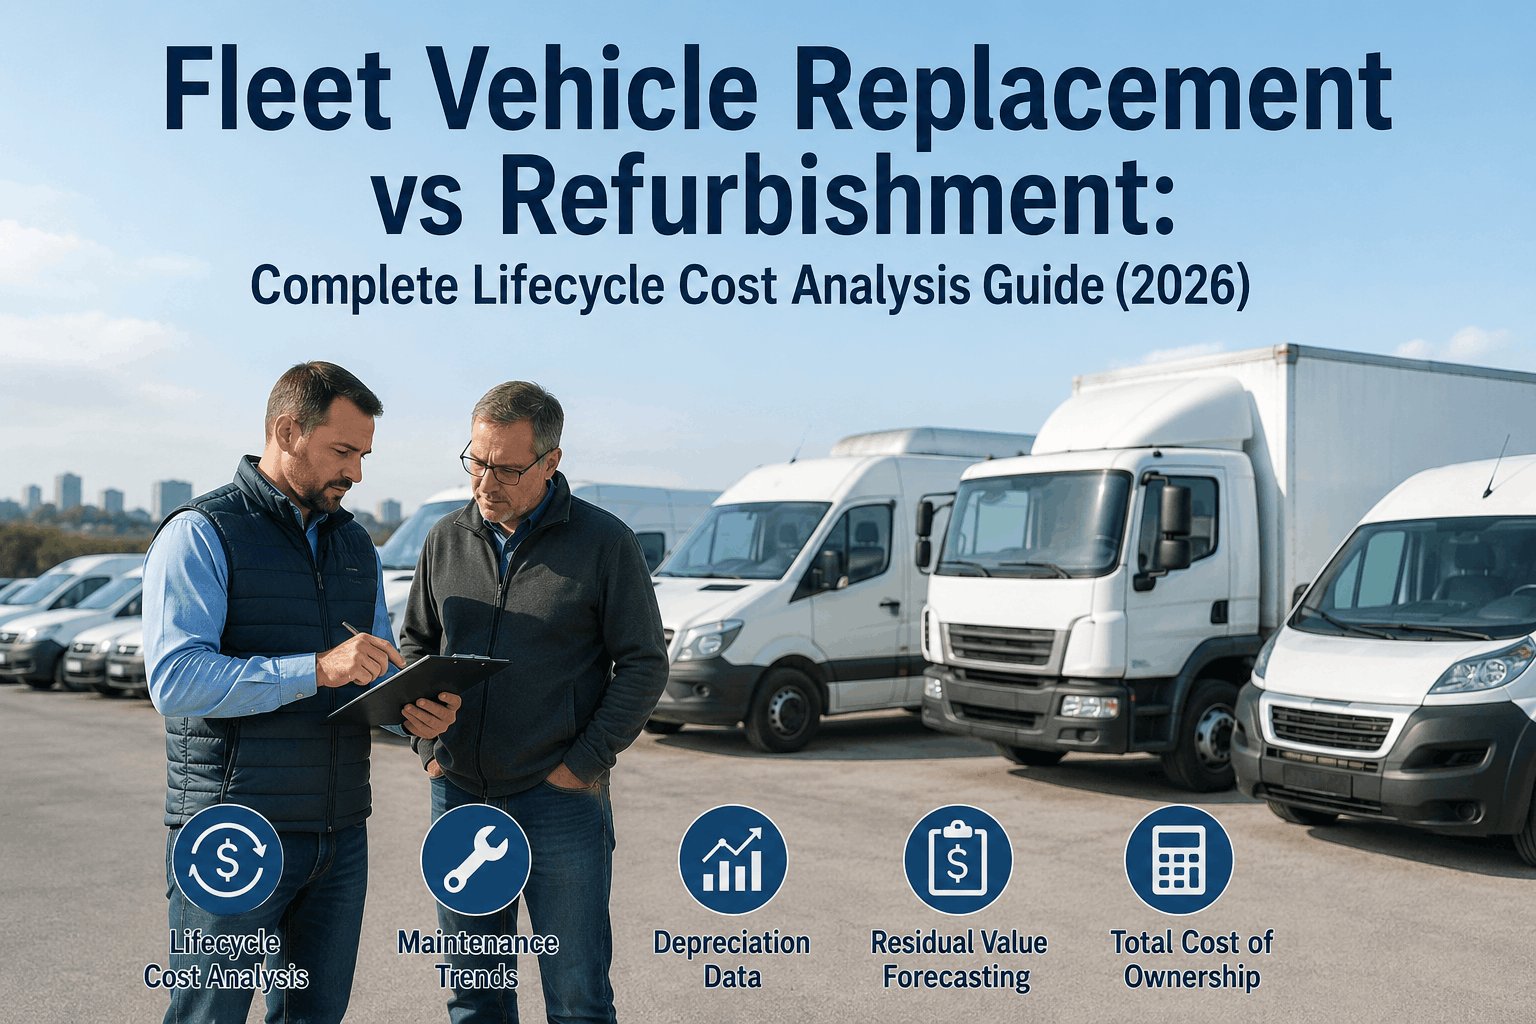
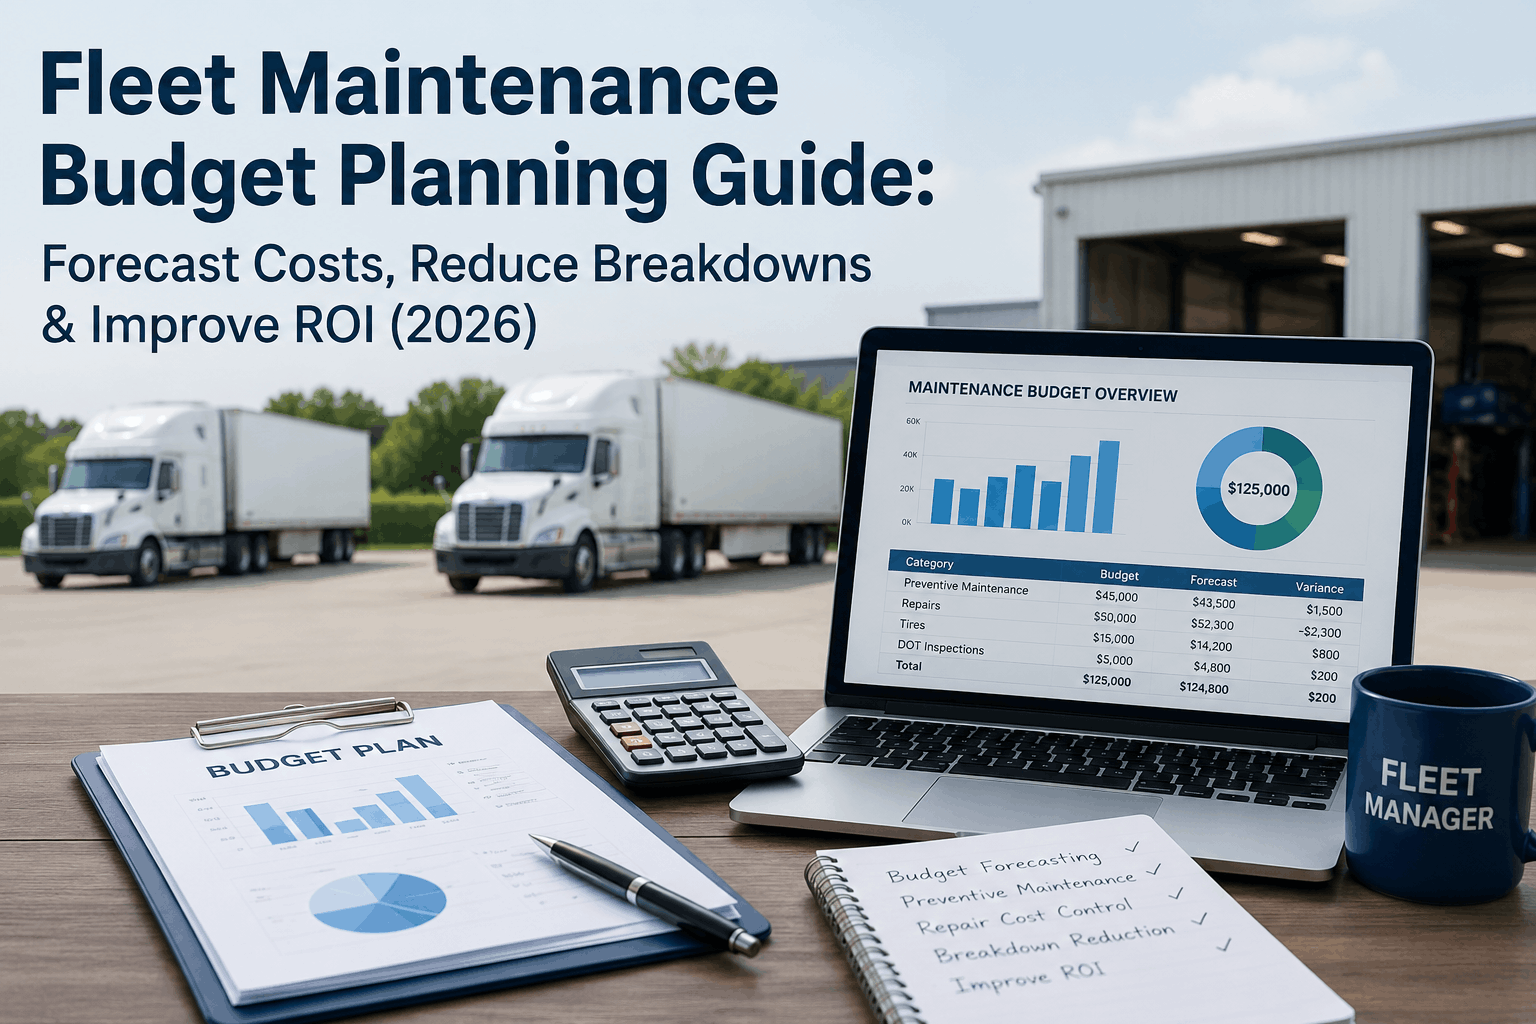
Every fleet vehicle reaches a point where the question stops being "how do we keep this running" and becomes "should we keep this running at all." Get the timing right and you capture the machine's full economic life while its resale value still funds the next one; get it wrong in either direction and you bleed money — replace too early and you throw away usable life, hold too long and maintenance costs and downtime quietly overtake what a new unit would cost. The data draws the line clearly: a vehicle aged 6 to 10 years costs around $0.15 per mile to maintain, but past 10 years that climbs toward $1.10 per mile — a sevenfold jump. Most fleets hit the economic crossover, where rising maintenance meets falling depreciation, somewhere around year 7 to 9. But between "keep" and "replace" sits a third option fleet managers often skip: refurbishment — rebuilding a structurally sound asset for a fraction of replacement cost to extend its life by years. The right call depends on lifecycle cost analysis, not gut feel or a blanket age rule. Tracking total cost of ownership per asset is what turns this into a data decision. This guide covers the cost-curve crossover, the replace-vs-refurbish math, the thresholds that signal each, and how to decide per vehicle.
Replace Too Early and You Waste Life. Hold Too Long and You Bleed Cash.
HVI tracks maintenance cost, downtime, and service history per asset, so the replace-refurbish-keep decision runs on real TCO data — surfacing the vehicle whose costs have crossed the line and the one with years of life still in it, instead of a blanket age rule that gets both wrong.
The Cost Curve: Where the Crossover Happens
Lifecycle cost analysis comes down to two opposing curves. Depreciation is steepest early and flattens; maintenance starts low and climbs. Where they cross is the economic sweet spot — and the signal to act.
DEPRECIATION
Highest in the first 3 years — a vehicle can lose 35–40% of value fast — then flattens. Depreciation is about 38% of total ownership cost, the single largest component early on.
CROSSOVER · YEAR 7–9
Where annual maintenance plus downtime rises to meet the annualized cost of a new unit. Past this point, every additional mile costs more than the vehicle's lifetime average. The decision point.
MAINTENANCE
Low early, then climbs steeply with age — from ~$0.15/mile at 6–10 years to ~$1.10/mile past 10 years. The curve that eventually forces the decision.
The optimal replacement point is where annual maintenance and repair cost plus scheduled downtime value exceeds the annualized cost of a new vehicle including depreciation and financing. For most heavy-duty trucks that economic life runs 500,000–750,000 miles; the ATRI industry replacement cycle sat at 7.3 years in 2024.
Three Choices, Not Two
The replace-or-repair framing misses the middle path. At the crossover, a fleet manager actually has three options — and the right one depends on the asset's condition and the cost math.
KEEP
Continue Operating
The right call before the crossover — the asset is still in its economic sweet spot. Maintenance is manageable, downtime low, and replacing now would throw away usable life and value.
When: under the cost thresholds, structurally sound
REFURBISH
Rebuild for a Second Life
The overlooked middle path. A structurally sound chassis with a worn powertrain or body can be rebuilt for a fraction of replacement cost, extending life by years — especially valuable for custom-upfitted units.
When: frame & core are sound, refurb < new cost
REPLACE
Retire & Renew
The right call once costs cross the line for good — maintenance plus downtime exceeds a new unit's annualized cost, or the structure is compromised. Sell at peak residual to fund the replacement.
When: past crossover, or structural/safety issues
Refurbish vs. Replace: The Trade-Off
When an asset is structurally sound, refurbishment competes directly with replacement. Each wins in different conditions — here's how they stack up so the math, not habit, decides.
REFURBISHMENT WINS WHEN
The chassis and frame are structurally sound
Cost is a fraction of a new unit's price
Custom upfit has second-life value on the asset
New-unit lead times are long (12+ months)
Capital budget is constrained this cycle
REPLACEMENT WINS WHEN
Maintenance + downtime tops a new unit's annual cost
The frame or core structure is compromised
Newer units offer real fuel/safety/emissions gains
Residual value is still high enough to capture
Reliability has dropped below operational needs
The Thresholds That Signal "Decide Now"
You don't have to guess when the crossover is near. Industry research gives concrete trigger points — when an asset hits any of these, it's time to run the full lifecycle analysis.
150%
of class average
When a vehicle's rolling 12-month maintenance cost exceeds 150% of the fleet average for its class, seriously evaluate replacement.
50%
repair vs. value
When a single repair exceeds 50% of the vehicle's current value, the math no longer supports continued repair.
30%
annual maintenance
When annual maintenance reaches 30% of vehicle value, the unit is nearing end-of-life — plan replacement within 12 months.
7–9 yr
economic life
The typical crossover window where maintenance meets depreciation — refined by class and the fleet's own cost data.
The Lifecycle Decision in Four Steps
Turn the analysis into a repeatable process. Run these four steps on any asset approaching the crossover, and the keep-refurbish-replace answer falls out of the data.
1
Pull the TCO
Assemble the asset's full cost — acquisition, maintenance, downtime, fuel — and its 12-month trend against the class average.
2
Check the Thresholds
Test against the 150%, 50%, and 30% triggers and the economic-life window. Any breach moves the asset into decision mode.
3
Assess Condition
Inspect the structure. A sound frame opens refurbishment; a compromised one forces replacement regardless of cost math.
4
Decide & Time It
Keep, refurbish, or replace — and if replacing, sell at the spring residual peak to capture maximum value.
Make Every Lifecycle Decision on Data, Not Age
Per-asset total cost of ownership, maintenance-cost trending against class benchmarks, threshold alerts, downtime tracking, and complete service history that supports both refurbishment ROI and replacement timing — all in one platform. Capture full economic life without bleeding cash past the crossover. Trusted by 25,000+ users worldwide.
Frequently Asked Questions
When should a fleet vehicle be replaced?
At the economic crossover — the point where annual maintenance and repair cost plus scheduled downtime value exceeds the annualized cost of a new vehicle including depreciation and financing. For most heavy-duty trucks that falls between 500,000 and 750,000 miles, and the typical age window is 7 to 9 years (the ATRI industry cycle was 7.3 years in 2024). Concrete trigger points include a single repair exceeding 50% of the vehicle's value, annual maintenance reaching 30% of value, or 12-month costs exceeding 150% of the class average. A blanket age rule misses these — decide per asset on its own cost data.
Sign up for a free HVI trial to track the crossover.
When does refurbishment make more sense than replacement?
Refurbishment wins when the chassis and frame are structurally sound but the powertrain or body is worn, because rebuilding costs a fraction of a new unit and can extend service life by years. It's especially compelling for custom-upfitted vehicles where high-quality specialized equipment has "second life" value and can move to a refreshed asset, and when new-unit lead times are long (often 12+ months for upfitted work trucks) or capital budgets are tight. The deciding test is whether the refurbishment cost plus the asset's remaining life beats the annualized cost of replacing it — and whether the core structure justifies the investment.
Schedule a demo to model refurbish-vs-replace.
What is total cost of ownership for a fleet vehicle?
TCO is every expense across a vehicle's operational life, not just its purchase price: acquisition and financing, licensing and insurance, fuel, scheduled maintenance and unplanned repairs, parts, administrative overhead, downtime cost, and residual value at disposal. Depreciation is typically the largest single component at around 38% of TCO, with the steepest loss in the first three years. Because fleets driven by quarterly budgets routinely underestimate these cumulative costs, building a per-asset TCO model that reflects your actual duty cycle is the foundation of every sound replace-or-refurbish decision.
Sign up for a free HVI trial to build per-asset TCO.
Why is a blanket age-based replacement rule a mistake?
Because it over-retires some assets and under-retires others. A rule like "replace everything at seven years" ignores that replacement thresholds vary significantly by vehicle class, duty cycle, and maintenance quality — a lightly-used unit may have years of economical life left at seven years, while a hard-worked one may have crossed the line at five. Class-specific thresholds refined with the fleet's own per-vehicle cost data deliver the precision a blanket rule can't, capturing full economic life on some assets while retiring others before they start bleeding cash.
Schedule a demo to see class-based analysis.
How do I maximize resale value when replacing a vehicle?
Two levers matter most: condition records and timing. A clean, complete maintenance history directly raises a used vehicle's residual value because buyers pay for documented care — which is one more reason to track service digitally throughout the asset's life. On timing, commercial vehicle residual values follow seasonal patterns, peaking in spring when contractor and seasonal-operator demand is highest; vehicles sold from summer into fall can lose 5–10% of potential residual value compared to an optimal spring sale. Plan disposition for spring with full records in hand to capture peak value to fund the next unit.
Sign up for a free HVI trial to keep resale-ready records.