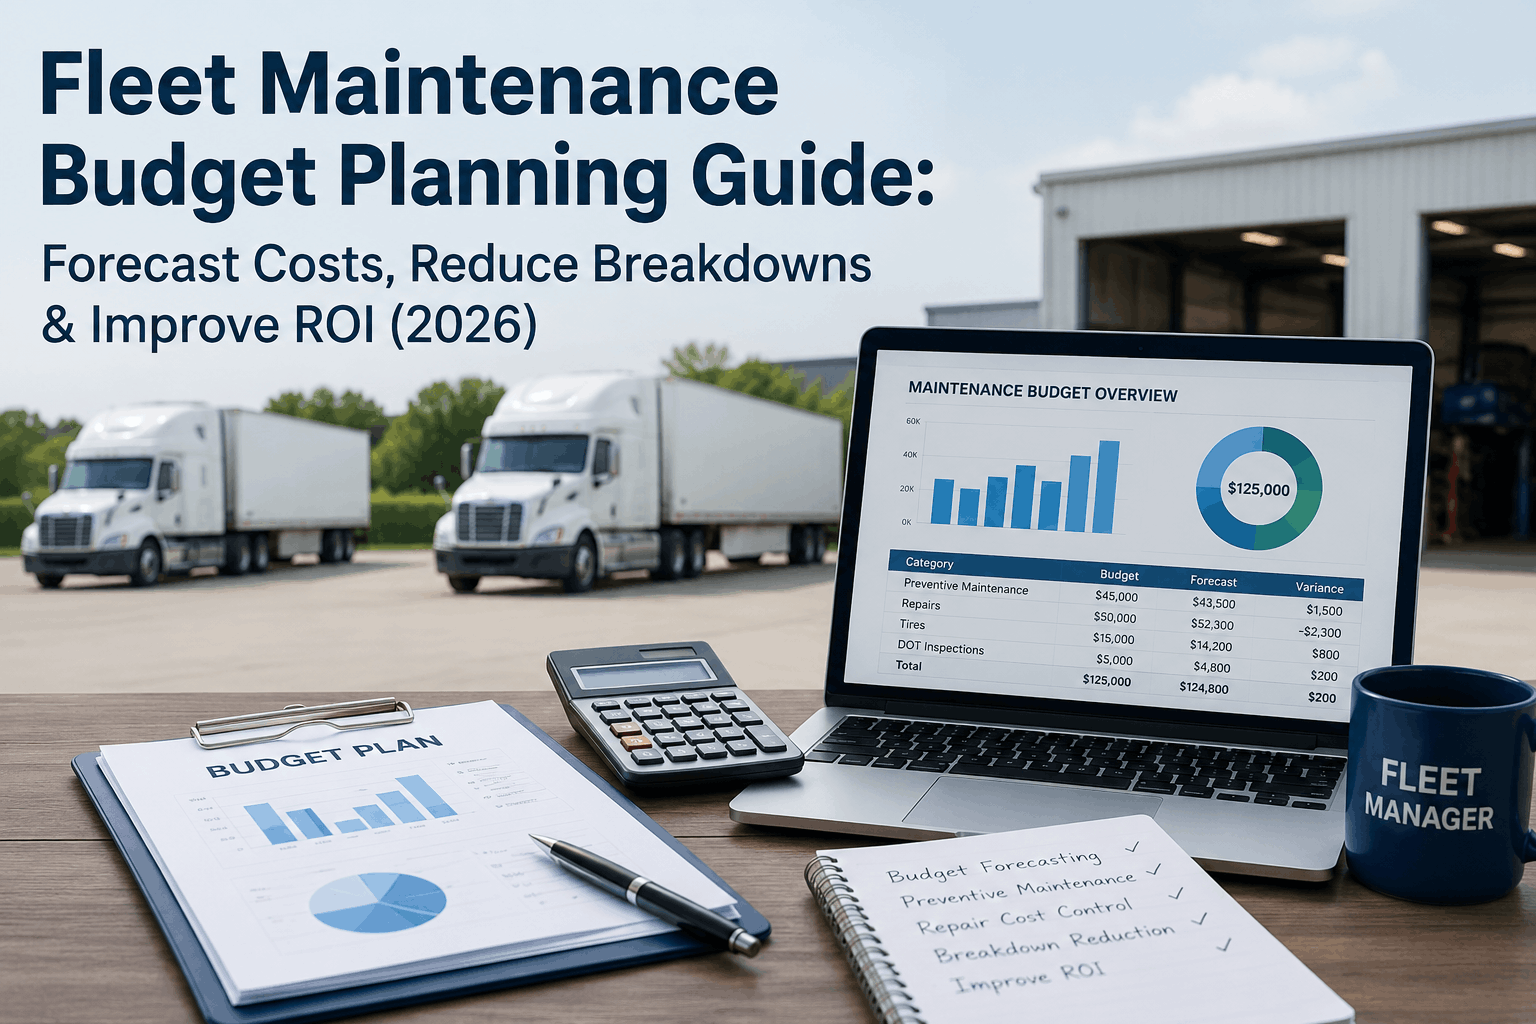
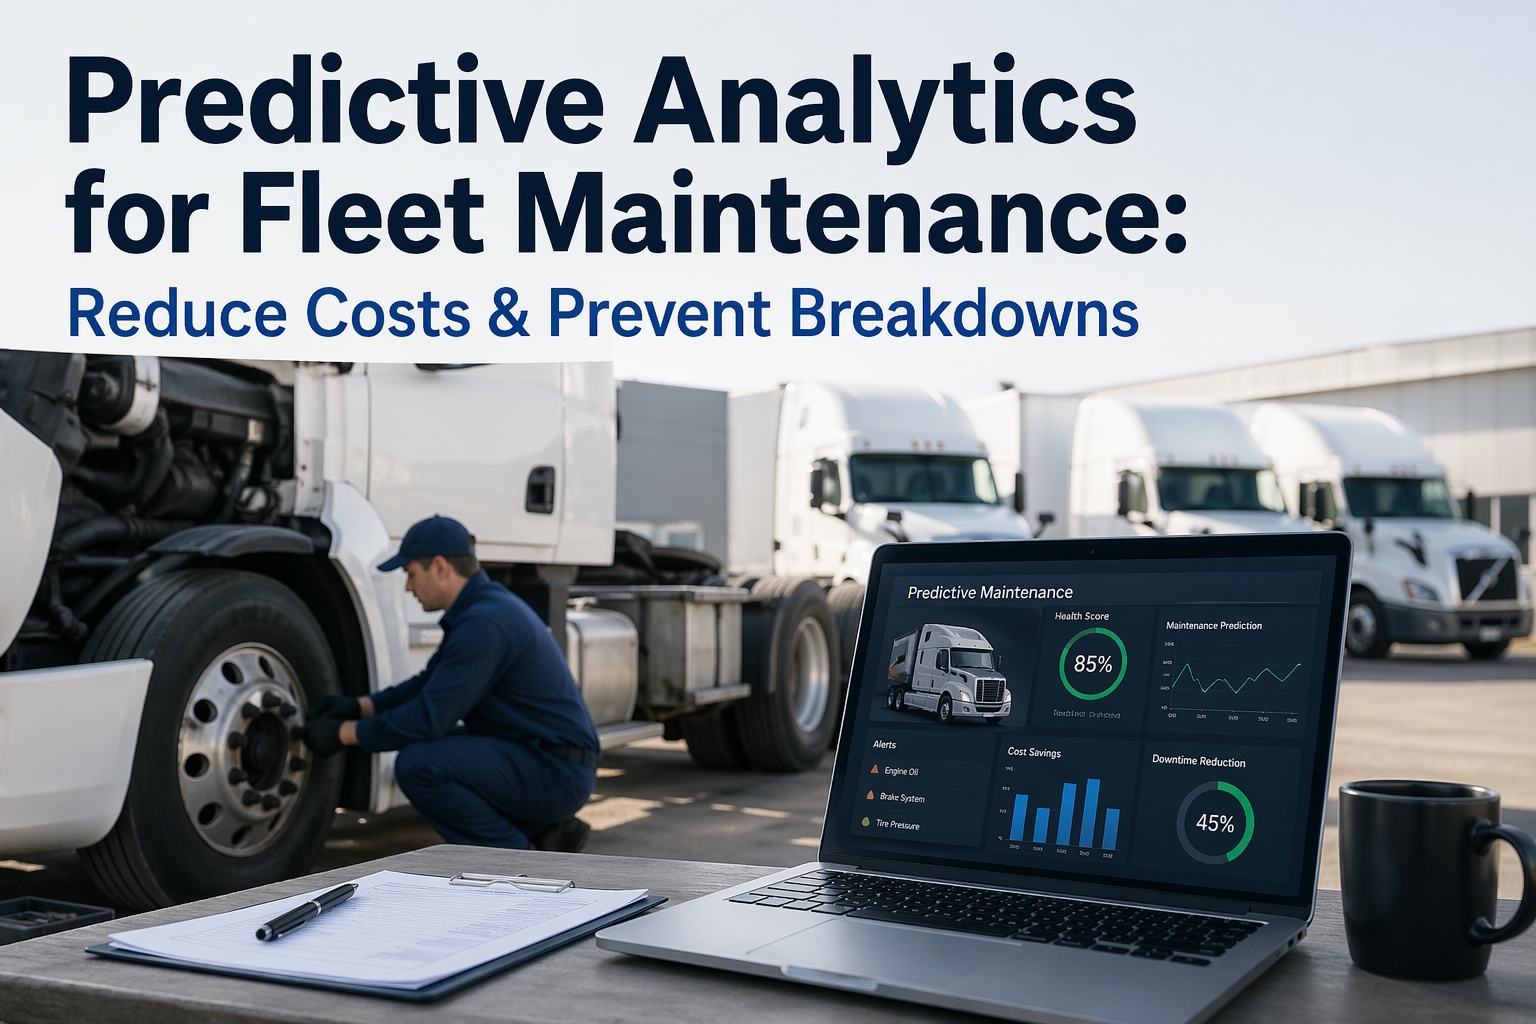
Fleet maintenance is the second-largest controllable cost on most fleet P&Ls after fuel — and the cost that varies most between fleets running the same trucks on the same lanes. The 2026 industry average for heavy-duty maintenance is $0.202 per mile or roughly $16,192 per truck per year, accounting for 8.9% of total fleet operating expenses,but the top-quartile and bottom-quartile fleets are 60–150% apart on the same metric. The fleet spending $0.30 per mile on maintenance is not 50% more expensive than the fleet at $0.20 per mile — on a 100-truck fleet running 80,000 miles per vehicle per year, that is $800,000 in annual waste. The difference is not vehicle age, talent, or geography. It is whether the fleet runs an actual budget — built from forecast formulas, optimized PM-to-reactive ratio, age-based cost curves, and KPI-driven monthly variance review — or whether it treats maintenance spending as whatever the repair invoices add up to at month-end. This guide gives fleet managers, maintenance directors, and trucking owners the framework for building an annual fleet maintenance budget that forecasts within ±5%, identifies the assets quietly draining the P&L, optimizes PM spending against breakdown prevention, and produces the ROI calculation that justifies the program to the CFO. The cost-driver math is unforgiving: reactive repairs run 3–9× the cost of planned maintenance, vehicles over 10 years old produce 33.5% of service spend on 12.1% of miles, and emergency parts orders carry 3–5× standard pricing. Each is a budget line item that responds to specific operational discipline. HVI's inspection & maintenance software auto-calculates cost-per-mile, PM-to-reactive ratio, and per-vehicle trend from every work order — making the budget a measurable program instead of an annual spreadsheet exercise.
Build a Budget That Forecasts to ±5%, Not ±25%
HVI auto-tracks cost-per-mile per vehicle, PM compliance percentage, reactive-vs-planned ratio, and age-curve trend forecasting from every work order — turning the maintenance budget from an annual estimate into a monthly measurable program.
The 2026 Cost Baseline — Know the Numbers Before You Budget
Every budget starts with a benchmark. Here is what fleets are actually spending in 2026, by vehicle class. Your starting point is whether you sit above or below these averages.
HEAVY-DUTY (Class 8)
$16,192
per truck / year
$0.15–$0.25/mile depending on age and duty cycle
MEDIUM-DUTY
$3,000–$5,000
per truck / year
$0.15–$0.20/mile for box trucks & delivery vans
LIGHT-DUTY
$1,200–$2,000
per vehicle / year
$0.10–$0.15/mile for cars, pickups, small vans
INDUSTRY AVG
8.9%
of operating cost
Maintenance share of total fleet operating expenses
If your fleet is more than 25% above these averages, the gap is operational — not equipment or geography. The 90-day operational fixes in this guide consistently close it.
Start free with HVI.
The Budget Formula — Build It from Five Inputs
A defensible fleet maintenance budget is not "last year plus 5%." It is the sum of five forecast components, each calculated independently from your own data. Build it this way and the variance lands at ±5% instead of ±25%.
The PM-to-Reactive Ratio — Where Most Budgets Bleed
The single most important number in your maintenance budget is not the total — it is the ratio of planned spending to reactive. This is the difference between a 60-150% spread between top and bottom quartile fleets.
BEST-IN-CLASS
80–85%
PM
15–20%
Reactive
Top-quartile fleets. Cost per mile 20-30% below industry average. Vehicles available 95%+. Replacement decisions data-driven.
INDUSTRY AVERAGE
55–60%
PM
40–45%
Reactive
Most fleets sit here. Reactive spend producing 3-9x cost multiplier. Emergency parts orders at 3-5x premium. Significant optimization runway.
BOTTOM QUARTILE
40–45%
PM
55–60%
Reactive
Costs spiraling. Cascading failures from skipped PMs. Each missed PM increases breakdown probability 15-25%. Insurance and CSA exposure rising.
THE 10% RULE
Every 10-percentage-point shift from reactive to planned maintenance reduces total maintenance costs by 8–12% at minimum, and by 15-20% in fleets that combine the shift with parts inventory optimization. For a $1.6M annual maintenance budget on 100 trucks, that is $128,000–$320,000 in recurring annual savings — recovered every year, not just once.
The Age Curve — Where Aging Trucks Quietly Destroy the Budget
This is the data that surprises every CFO: a small number of old vehicles eat a disproportionate share of the maintenance budget. The cost curve does not rise linearly — it inflects sharply around year 7.
Vehicle Age
Cost per Mile
Unplanned Downtime / Year
Roadside Breakdown Risk
0–3 years
$0.08 – $0.12
~12 hours
Baseline
4–6 years
$0.15 – $0.20
~28 hours
1.5–2x baseline
7–9 years (inflection)
$0.22 – $0.45
~52 hours
3–4x baseline
10+ years
$0.70 – $1.10
~89 hours
5x+ baseline
33.5%
Per Fleetio's 2026 Fleet Benchmark Report (1.2M vehicles, $7B service spend), vehicles over 10 years old account for just 12.1% of total miles driven but represent 33.5% of total service spend. Identifying these assets is the highest-leverage budget move available.
The Replacement Threshold Math
The financial decision every aging asset eventually triggers: keep maintaining or replace. There is a number that answers it.
The 40–45% Rule
When annual maintenance cost on a vehicle exceeds 40–45% of its current market value, replacement is the cheaper financial decision over a 3-year horizon. The math: maintenance costs increase 25–30% annually on aging vehicles, so a $1,400/month maintenance bill becomes $2,200+ within 3 years.
The Monthly Comparison
New truck financing: $1,800–$2,500/month. If an aging vehicle's maintenance cost exceeds $1,400/month consistently, replacement math favors swap — even before counting fuel efficiency (older trucks lose 15-20% MPG), downtime value, and CSA exposure from roadside breakdowns.
Three-Year Projection
Run the math forward, not backward. A truck costing $14,000/year in year 7 at the 25-30% annual increase rate costs $17,500 in year 8 and $22,000+ in year 9. Show leadership the projection — replacement cases get approved on forward-cost visibility, not historical spend reports.
The 6 KPIs That Make the Budget Real
A budget without measurement is a guess. These six KPIs convert the budget from an annual estimate into a monthly variance-tracked program — the operational disciplines that produce the ±5% forecast accuracy.
Cost per Mile
Target: at or below class average
Calculate monthly per vehicle. Rising CPM is the earliest signal of a vehicle approaching replacement threshold or a process problem.
PM Compliance %
Target: 95%+ (the 10% rule)
A PM must complete within 10% of its scheduled interval to count as on-time. Improving from 70% to 95% reduces breakdowns by ~50%.
Reactive-vs-Planned Ratio
Target: 80/20 or better
The single most revealing metric of program financial maturity. Every 10% shift to planned cuts total costs 8-12%+.
Vehicle Availability
Target: 93–95%+
Availability = MTBF ÷ (MTBF + MTTR). 93% acceptable, 95%+ is world-class. Tells you whether the budget is producing the uptime the business needs.
MTBF / MTTR
Target: by equipment type
Mean Time Between Failures (reliability) and Mean Time To Repair (maintainability). Together they produce availability and explain why the budget moved.
First-Time Fix Rate
Target: 85%+
Percentage of repairs that fix the issue first time, without rework. Low rate signals diagnostic gaps or skill issues — both budget killers through repeat-repair costs.
Track all six monthly per vehicle, per class, and per terminal. The KPIs that move first tell you which operational lever to pull next.
Book a demo to see the dashboard.
The Hidden Cost Stack — What the Repair Invoice Does Not Show
The maintenance budget that only tracks invoice cost is missing 30-50% of true cost. Here is what the line items hide.
Downtime per vehicle per day
$448 – $760
Lost revenue, delivery penalties, customer goodwill
Administrative overhead
8–12% of direct cost
Coordination, invoice processing, vendor management
Emergency parts premium
3–5× standard pricing
Same part, expedited shipping. Eliminated by PM scheduling.
Towing & recovery
$800 – $1,500/event
Per roadside breakdown — and old vehicles have 5x the breakdown rate
Rental equipment to fill gaps
$200 – $400/day
When down vehicle pulls a load that must still move
Overtime labor for rushed repairs
1.5× standard rate
Reactive culture creates after-hours repair patterns
The ROI Calculation Leadership Approves
The case for investing in a structured maintenance program — whether software, additional technicians, or process discipline — is built on a specific ROI math. Here is the calculation that gets the CFO sign-off.
SAVINGS
15–25% reactive repair reduction
10–15% parts cost optimization
15–20% labor efficiency gain
Warranty recovery (5–8% of repair cost)
Downtime reduction (vehicle-day value)
REAL EXAMPLE
A 75-truck fleet implementing structured PM with photo-verified inspections reduced breakdowns by 65% and cut emergency repair costs by $127,000 in the first year alone — before counting downtime recovery, warranty captures, or CSA score improvements. ROI realized inside 90 days.
The Monthly Variance Review — The Discipline That Hits ±5%
A budget is hit or missed not at year-end but on the first Monday of every month. The 30-minute variance review that produces the ±5% forecast accuracy.
1
Pull actual vs forecast by line item. PM spend, reactive spend, tires/wear, downtime contingency, inflation buffer. Variance flagged on any line over ±10%.
2
Identify the asset(s) driving variance. Per-vehicle CPM trending up? Vehicle approaching age inflection or process gap. PM compliance dropping? Operational issue, not budget issue.
3
Check the ratio. Reactive-to-planned shifting? Every 10% shift toward reactive is an 8-12% budget hit incoming. Pull forward to next month.
4
Action item per variance. Vehicle replacement analysis, PM schedule audit, vendor renegotiation, parts inventory optimization. Each variance gets a documented action with owner and due date.
5
Forward forecast adjustment. Update the remaining-year forecast based on YTD trend. Catch the miss in month 3 — not in month 11 when nothing can be done.
Run the Budget. Hit the Forecast. Reduce the Spread.
Per-vehicle cost-per-mile tracking. PM compliance + reactive ratio monitoring. Age-curve trend forecasting. Monthly variance reporting. Six-KPI dashboard. Trusted by 25,000+ users worldwide.
Frequently Asked Questions
Q: What is the average fleet maintenance cost per mile in 2026?
Heavy-duty trucks average $0.202 per mile or roughly $16,192 per truck per year — representing 8.9% of total fleet operating expenses. Medium-duty runs $0.15-$0.20/mile ($3,000-$5,000/year), and light-duty $0.10-$0.15/mile ($1,200-$2,000/year). Top-quartile fleets operate 20-30% below these averages through PM discipline. Bottom-quartile fleets run 50-150% above — the spread between top and bottom is enormous for the same vehicle classes on the same lanes.
Q: What is the right PM-to-reactive maintenance ratio?
Best-in-class fleets run 80-85% preventive / 15-20% reactive. Industry average is 55-60% preventive / 40-45% reactive. Bottom quartile sits at 40-45% preventive / 55-60% reactive. The 10% rule: every 10-percentage-point shift toward planned reduces total maintenance costs by 8-12% at minimum, because reactive repairs cost 3-9× more than planned. For a $1.6M annual budget, that is $128,000-$192,000 in recurring savings per 10% ratio shift.
Start free with HVI.
Q: When should I replace a vehicle vs continue maintaining it?
Replace when annual maintenance cost exceeds 40-45% of the vehicle's current market value. The math: maintenance costs increase 25-30% annually on aging vehicles, so today's $14,000/year becomes $17,500 next year. If new-truck financing is $1,800-$2,500/month and your aging vehicle averages $1,400+/month in maintenance, replacement math favors the swap — and that's before factoring 15-20% MPG loss, downtime, and CSA exposure.
Book a demo.
Q: How accurate should my annual budget forecast be?
Fleets running a 5-component forecast (PM, reactive, tires/wear, downtime contingency, inflation buffer) with monthly variance reviews consistently hit ±5% accuracy at year-end. Fleets relying on "last year plus 5%" typically miss by ±25% or worse — usually on the wrong side. The accuracy gap is not forecasting skill; it is whether you measure the six KPIs monthly and catch variances in month 3 instead of month 11.
Q: What hidden costs do most fleet budgets miss?
Six categories that add 30-50% to true cost above repair invoices: downtime ($448-$760/day per vehicle), administrative overhead (8-12% of direct costs), emergency parts premium (3-5× standard pricing), towing & recovery ($800-$1,500 per breakdown), rental equipment to fill gaps ($200-$400/day), and overtime labor for rushed repairs (1.5× standard rate). A budget that only tracks invoice cost is structurally underestimating true spend.
Start free today.
Q: How does HVI support fleet maintenance budgeting?
HVI auto-calculates cost-per-mile per vehicle, PM compliance percentage, reactive-vs-planned ratio, MTBF/MTTR/availability, and age-curve trends from every closed work order — no spreadsheets, no manual entry. The dashboard surfaces month-over-month variance against forecast, identifies the assets driving budget drift, flags vehicles approaching the 40-45% replacement threshold, and produces the ROI calculation that justifies the program to leadership. The budget becomes a measurable operational program instead of an annual estimate.
Book a demo.