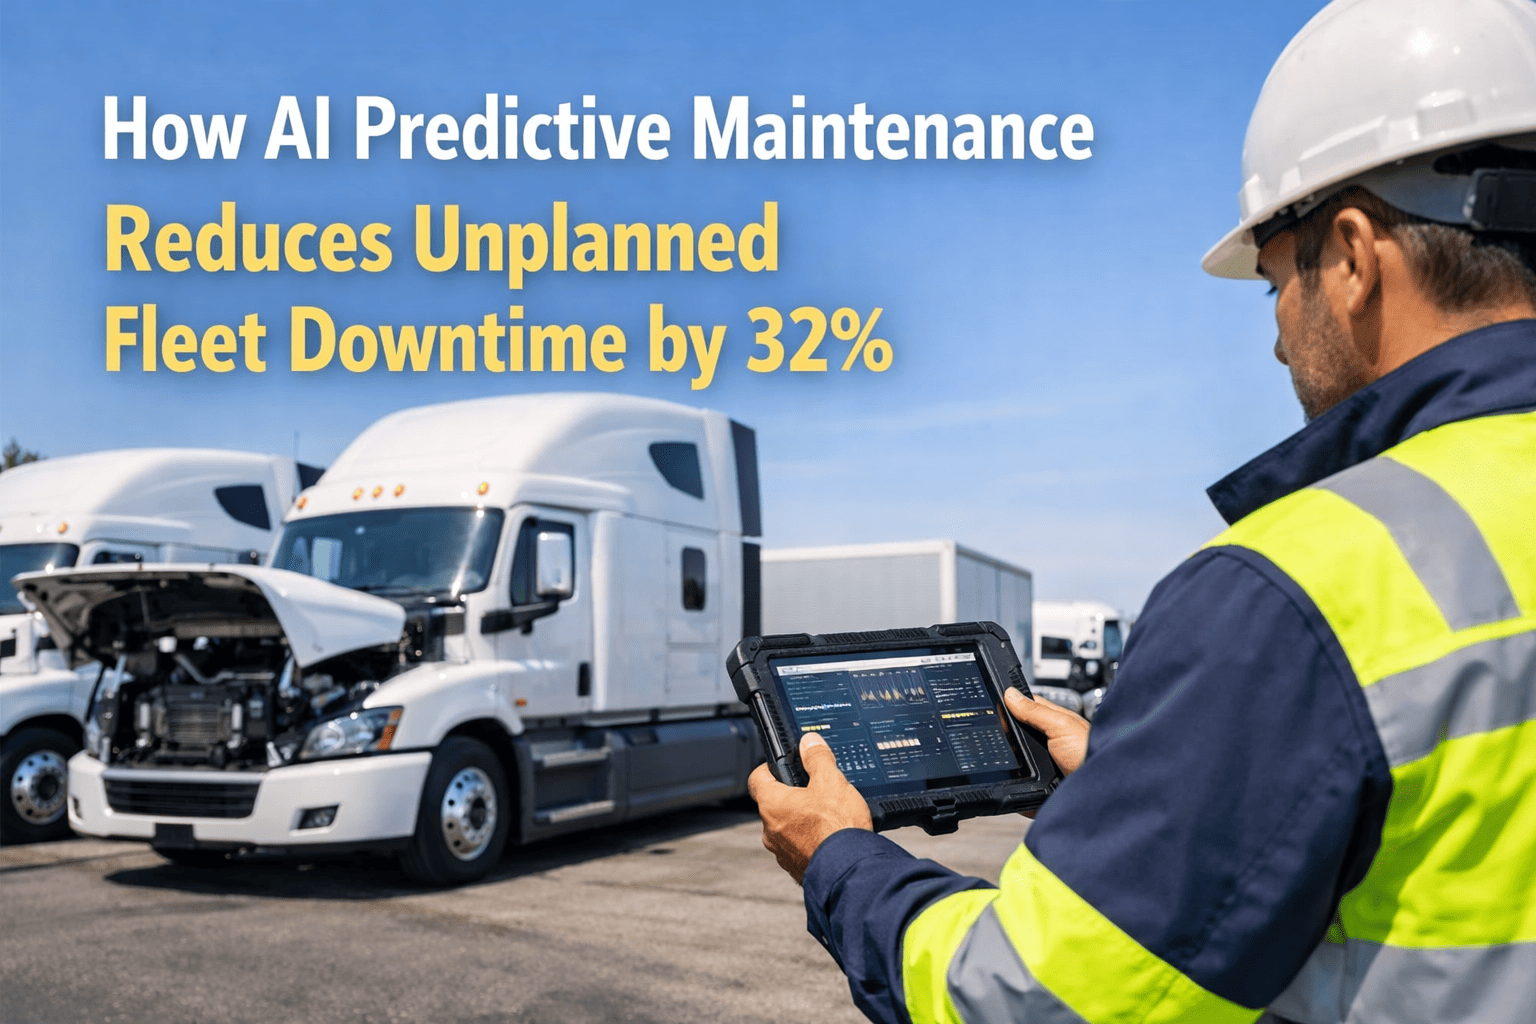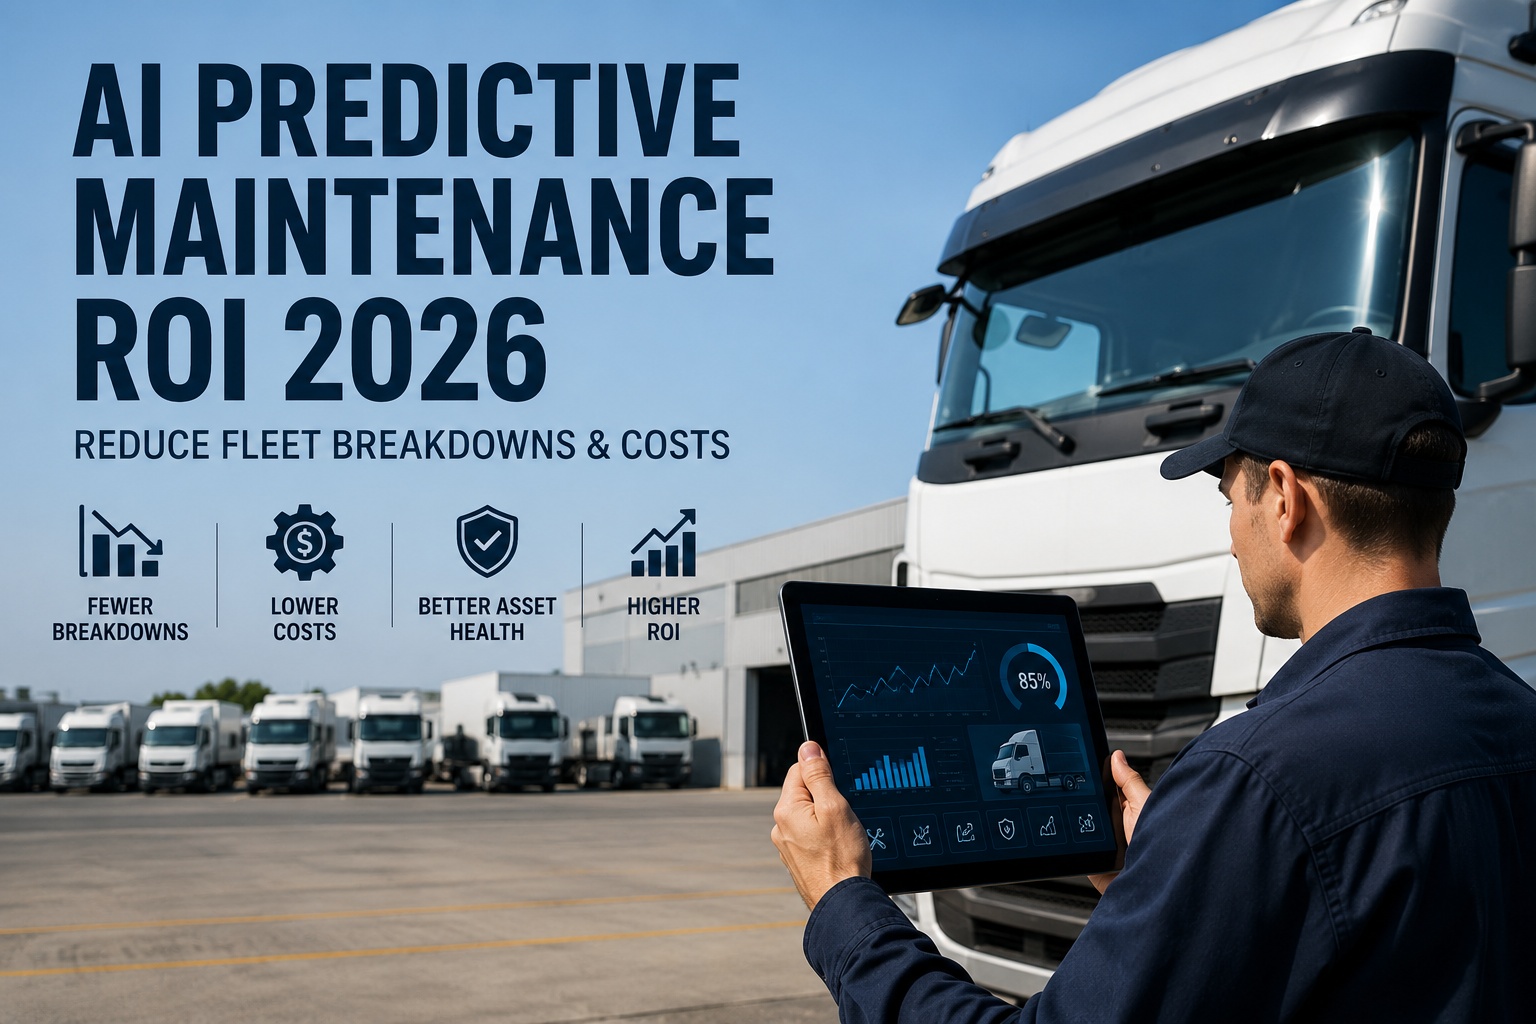
Your Cascadia's turbo would have grenaded on I-95. AI flagged the back-pressure anomaly six weeks early. Cost: $2,400 during a scheduled dock day. Catastrophic cost: $47,000 plus three days of freight recovery. That's the ai predictive maintenance roi story every 2026 fleet director is trying to quantify — and the one 73% of fleets still can't answer because they're running reactive maintenance. This guide walks the maturity model, four ROI sources, case-study math, and the 4-phase implementation roadmap. Book a 15-min HVI demo.
Reactive Costs 3-5× More. Preventive Overspends. Predictive Wins.
The maintenance strategy your fleet runs today is the biggest single lever on next quarter's operating margin. Here's what the 27% deploying AI already know — and what the other 73% will learn expensively.
The Maintenance Maturity Model
Every fleet operates at one of three maturity stages. The stage you're at today defines your cost structure, uptime, and competitive position. Moving up one stage typically recovers a quarter's worth of margin; moving up two changes the P&L conversation entirely.
What AI Predictive Maintenance Actually Is (Beyond the Marketing)
Strip the buzzwords and AI predictive maintenance is straightforward: machine learning models continuously analyze vehicle telemetry, inspection data, and historical repair records to calculate the probability that a specific component will fail within a defined timeframe. When probability exceeds threshold, the system generates a work order — before the failure happens, during a planned service window, at planned-repair rates. 75% of equipment failures show detectable warning signs days or weeks before they happen. AI catches those signals; humans reviewing dashboards typically don't.
The distinction from preventive maintenance matters. Preventive services by a fixed calendar or hour interval — changing an oil filter every 250 hours regardless of whether it needs it. Predictive services by actual condition. Same filter, replaced when analysis says it's approaching end-of-life, not before. Preventive over-services 30-40% of components; predictive right-times them. Start a free HVI trial to see condition-based intervals against your current calendar-based plan.
The Four Sources of ROI
AI PdM ROI compounds from four independent sources. Every documented 2026 case study attributes savings to some combination of these — and the largest returns come from stacking all four.
Real 2026 Case Studies
Two documented deployments, different fleet sizes, both recovering multiples of platform cost in Year 1.
The Simple ROI Math for Your Fleet
Every fleet's number is different, but the calculation framework is the same. Four inputs, four steps. You already have every input in your CMMS or work-order system.
Year 2 typically runs 30-40% higher than Year 1 as ML models reach peak accuracy and lifespan extension materializes. This is why documented ROI headlines land at 10:1 to 30:1 over 12-18 months, not the first-quarter number.
Get Your Fleet's Specific Number
Book a 15-minute demo and we'll walk through the same calculation for your fleet size, vehicle mix, and current maintenance spend. No hardware to install, no telematics to buy — HVI reads your existing data streams and models your recovery from day one.
The 4-Phase Implementation Roadmap
AI predictive maintenance deployment isn't a technology project; it's an operational transition. The fleets recovering 10:1 ROI didn't rip and replace their tech stack — they layered predictive intelligence onto what they already had. Here's the sequence that works, executed over roughly 180 days.
The 5 Pitfalls That Kill Predictive Maintenance ROI
Every failed AI PdM deployment fails for one of these reasons. Every one is avoidable with disciplined execution of the roadmap above.
Data Quality: The Foundation Nobody Puts on the Slide
AI predictive maintenance is only as good as the data it trains on. Fleets running paper DVIR forms, spreadsheet work orders, and disconnected telematics systems will not get 10:1 ROI — the models can't learn from noise. This is why the fleets recovering documented savings all have one thing in common: they digitized their inspection and work-order workflow before the AI layer went live.
The order matters. Digital inspection records give AI physical-condition signals (tire wear, fluid leaks, visible cracks) that telematics cannot see. Structured work-order data gives AI the labeled outcome data ML models train against. Fuel and hour-meter accuracy gives AI accurate duty-cycle context. Miss any of these and prediction accuracy collapses from the 85-95% industry benchmark to something closer to random guessing. Start with the digital inspection and CMMS layer; the AI adds compounding value on top of that foundation.
Reactive vs Preventive vs Predictive: The Head-to-Head
Same fleet, three maintenance strategies, three cost profiles. This is the comparison a CFO signs off on.
| Dimension | Reactive | Preventive | Predictive (AI) |
|---|---|---|---|
| Trigger | Failure | Calendar / hours | Condition |
| Repair Timing | Emergency | Scheduled early | Scheduled optimal |
| Cost Per Repair | 3-5× baseline | Baseline | 0.7× baseline |
| Unplanned Downtime | Full exposure | Partial | Minimal |
| Component Lifespan | Minimized | Under-utilized | Optimized |
| Parts Inventory | Reactive stocking | Buffer stocking | Just-in-time |
| Data Requirements | None | Basic hour meter | Multi-source integration |
| Fleet Availability | 78-85% | 87-92% | 94-96%+ |
| Adoption (2026) | 73% of fleets | Overlaps | 27% of fleets |
The 38-point gap: 65% of fleet maintenance teams plan to deploy AI predictive maintenance by end of 2026 — but only 27% have actually deployed. That 38-point gap is where operational competitive advantage is being built right now. Fleets that deploy first hold a 12-18 month lead over planners.
How HVI Delivers AI Predictive Maintenance
HVI layers predictive intelligence onto the digital inspection and CMMS foundation your fleet already needs. Four capabilities matter most.
Frequently Asked Questions
What ROI can we realistically expect from AI predictive maintenance?
Documented 2026 outcomes across industry data consistently show 10:1 to 30:1 ROI within 12-18 months, with typical payback periods ranging from 44 days to 6 months. Real case examples: a 35-vehicle construction fleet cut annual maintenance spend from $620,000 to $410,000 (Year 1), a 250-vehicle logistics operation saved $1.8 million annually combining 30% maintenance reduction with 45% downtime decrease. The single largest ROI source is downtime reduction (30-50% fewer unplanned hours) because unplanned events cost 3-5 times more than the same repair done during planned service. Year 2 ROI typically runs 30-40% higher than Year 1 as ML models reach peak accuracy and asset lifespan extension materializes.
How long does AI predictive maintenance take to implement?
A disciplined 4-phase rollout takes approximately 180 days from kickoff to fleet-wide operational deployment: Phase 1 data foundation audit (14 days), Phase 2 critical-20% pilot (30 days), Phase 3 threshold calibration and workflow integration (45 days), Phase 4 fleet-wide rollout and optimization (90 days). First actionable failure predictions typically arrive within 72 hours of pilot deployment, with ML baselines stabilizing by day 30. Most fleets see measurable reductions in unplanned breakdown frequency within the first 30 days. Full ROI — meaning cost savings exceed platform cost — is typically achieved within the first quarter for fleets with reasonable data hygiene.
Do we need new sensors or telematics hardware for AI PdM?
Usually not. Most commercial vehicles manufactured after 2015 already broadcast the diagnostic data AI models need through factory telematics or aftermarket ELDs. Modern AI PdM platforms read existing OBD-II, J1939, or telematics API feeds. Physical inspection data (tire wear, brake pad thickness, hydraulic hose condition, DEF crystallization) is captured through digital DVIR workflows on the technician's phone or tablet — not through new hardware. The exception is highly critical stationary or specialized equipment where vibration sensors, ultrasonic monitors, or thermal imaging can add signals worth the $15-50 per-unit cost. Most fleets never need to install new hardware to hit their Year 1 ROI target.
What accuracy can I expect from AI failure predictions?
Modern ensemble machine learning models achieve 85-95% precision on major component failure predictions including bearings, pumps, motors, alternators, turbochargers, and hydraulic components. Precision improves as models accumulate fleet-specific data, typically reaching peak accuracy at 90-120 days post-deployment. Physical inspection signals often precede sensor alerts by 2-3 weeks, which is why AI models fed both telematics and digital DVIR data outperform telematics-only models by roughly 15-20 percentage points on early detection. False positive rates on well-calibrated models run 5-8% — low enough that technicians trust the alerts, high enough that occasional healthy components get inspected. The economic case still holds even at 8% false positives because the cost of a preventive inspection is 1/20 the cost of a missed failure.
Should we run predictive and preventive maintenance together?
Yes — this is the recommended 2026 approach, and 66% of leading fleets use this hybrid strategy. Preventive maintenance stays in place for routine consumables (engine oil, filters, DEF top-up, greasing) and lower-value components where scheduled service is more cost-effective than sensor monitoring. Predictive AI runs on high-value and failure-critical components: engines, transmissions, hydraulic pumps, turbochargers, bearings, brakes. This layered approach captures the ROI benefits of predictive on the components where breakdown cost is highest, while keeping preventive discipline on the components where the math favors scheduled service. Together, the two strategies compound.
The 27% Are Already Ahead. The Question Is How Long You Wait.
HVI layers AI predictive maintenance onto digital inspections, work orders, and CMMS you already need — not a separate tech stack. First predictions in 72 hours. Documented ROI attribution in your dashboard. Payback in the first quarter for fleets with reasonable data hygiene. Book a 15-minute demo and we'll calculate your fleet's specific number.