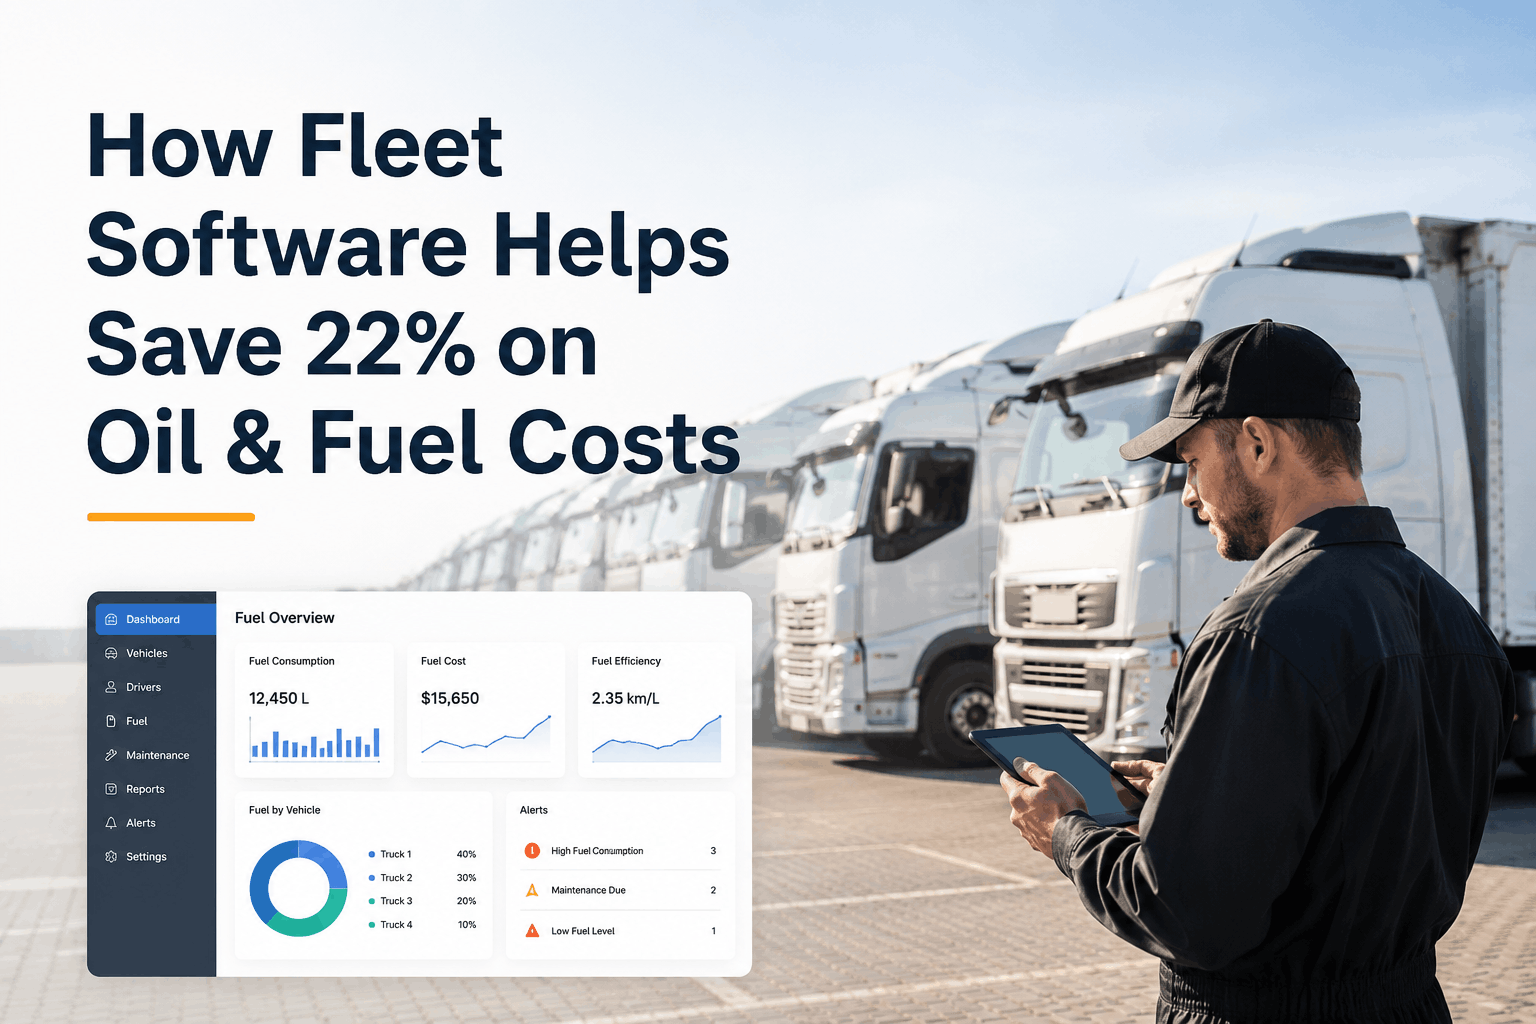
Fuel and oil are the largest controllable line items in any fleet budget — typically 30–40% of total operating cost. And in 2026, with diesel hovering above $4 a gallon and prices up nearly 20% year-over-year, every gallon you waste hits the P&L twice as hard as it did three years ago. The good news: research across hundreds of deployed fleets shows that modern fleet software — combining telematics, predictive maintenance, fuel tracking, and driver-behavior analytics — can cut fuel and oil costs by up to 22% within the first year. This guide breaks down exactly where those savings come from, what metrics drive them, and how HVI's inspection and maintenance platform fits into the math. Start your free HVI trial to digitize inspections, work orders, and fuel-linked maintenance records, or book a demo to see how HVI ties oil-change intervals and engine-hour data into your fuel-efficiency program.
Up to 22% fuel & oil savings — when software runs the data, not spreadsheets.
Where your fuel budget actually leaks
Before you can save 22%, you have to see the leaks. Across 2026 fleet audits, the breakdown of preventable fuel waste is remarkably consistent. This is what is hiding in your fuel spend right now.
The 22% — where every percentage point actually comes from
The "up to 22%" headline is not magic. It is a sum of measured, individual savings categories that fleet software unlocks. Here is the math, category by category, based on documented 2026 fleet outcomes.
For a 50-truck fleet running 80,000 miles per truck at 6.5 MPG, 22% savings translates to over $250,000 returned annually at $4.15/gal diesel. The numbers compound at scale — and they start showing up within the first 30 days of a clean rollout. Start your free HVI trial to capture the inspection-and-maintenance side of those savings from day one.
How does fleet software reduce fuel costs?
Modern fleet software is no longer one tool — it is a stack of five connected systems that turn engine hours, GPS data, fuel transactions, and inspection records into one fuel-efficiency dashboard. Each layer plays a specific role.
Every vehicle reports location, speed, acceleration, idle time, and fuel consumption to a central platform. This is the data layer everything else runs on — without it, the rest is guesswork.
Scorecards rank each driver on harsh events, speeding, idling, and braking. Bottom performers get targeted coaching, top performers get incentives. Fleets see 79% fewer hard accelerations after structured coaching.
Algorithms continuously analyze traffic, time windows, vehicle capacity, and driver break rules to generate the shortest practical routes. Fleets cut total mileage 10–22% — fewer miles, less fuel, fewer engine hours.
Engine-hour and odometer data trigger PM reminders at every interval. Clean injectors, fresh oil, healthy filters, and correct tyre pressure together deliver 2–5% MPG improvement — often the most overlooked fuel lever.
Card transactions reconcile automatically against vehicle location, engine hours, and fuel-tank capacity. Anomalies — off-route purchases, double-fills, after-hours buys — flag instantly. Typical fraud capture: 5–10% of fuel spend.
All five layers feed one dashboard with MPG, cost-per-mile, idle ratio, and PM compliance per vehicle. Managers spot the 15% of trucks consuming 40% of the fuel budget — and act before the next fill-up.
What fleet metrics improve fuel efficiency?
Software is only as useful as the metrics it surfaces. These six numbers are what high-performing 2026 fleets watch daily — and what HVI and connected telematics platforms can put on one dashboard.
The headline KPI. Track 30-day rolling average per truck and per driver — top performers will be 25–40% above the bottom.
Idle time as a percentage of total engine-on time. Anything above 25% is bleeding diesel — and accelerating engine wear at the same time.
ATRI's 2025 industry average was 16.7%. Every point below that is direct margin. Route optimization is the lever.
Combined count of hard braking, hard acceleration, and hard cornering. Driver coaching brings this down measurably within 30 days.
Percentage of scheduled PM services completed on time. A 4,000-mile-late oil change drops fuel economy 1–3% all by itself.
Total fuel spend divided by total miles. Strips out volume effects and shows whether efficiency is actually improving over time.
The oil-and-maintenance connection (the part most fleets miss)
Most fleet fuel programs focus on driver behavior and routing — and they leave oil-and-maintenance on the table. That's a mistake. Engine condition has a direct, measurable effect on fuel burn, and it's the lever HVI's inspection and maintenance platform was built around.
Running oil past its service interval thickens it, increases internal engine friction, and silently steals MPG. HVI fires PM reminders on actual engine hours.
A clogged air filter starves combustion. HVI's inspection checklists include filter status — drivers flag it before it costs you fuel.
Fault codes and DPF regen frequency feed directly into HVI work orders, catching efficiency problems before they need a tow.
Daily DVIRs in HVI capture tyre condition every shift — soft tyres get flagged, work orders get routed, MPG gets protected.
What 22% savings actually looks like by fleet size
The percentage stays roughly constant; the dollar value scales with fleet size and fuel volume. Here is what fleet managers are seeing across three real-world fleet sizes at 2026 diesel prices ($4.15/gal, 6.5 MPG average).
| Fleet size | Annual miles (per truck) | Pre-software fuel spend | 22% savings unlocked | Payback period |
|---|---|---|---|---|
| 10 trucks | 75,000 | $478,800 | $105,300 / yr | 3–5 months |
| 25 trucks | 80,000 | $1,277,000 | $281,000 / yr | 3–4 months |
| 50 trucks | 80,000 | $2,554,000 | $562,000 / yr | 2–4 months |
| 100 trucks | 85,000 | $5,422,000 | $1,193,000 / yr | 2–3 months |
| 250 trucks | 90,000 | $14,355,000 | $3,158,000 / yr | under 60 days |
Even at the smallest end, a 10-truck fleet recaptures over $100,000 a year — typically 10–20× the cost of the software itself. Schedule an HVI demo to see how the platform's inspection and maintenance side fits into your fuel-efficiency program, with a fleet-specific ROI breakdown in 30 minutes.
The 5-step rollout to capture 22% — start to first savings
Most fleets see their first measurable savings within 30 days. Here's the proven sequence to get there without the usual rollout mistakes.
Pull 90 days of fuel-card data and current MPG by vehicle. Establish a baseline so you can prove the savings, not just feel them.
Install ELD/telematics, connect HVI inspection app, and integrate fuel cards. Most modern fleet stacks talk to each other via API in under 48 hours.
Launch driver scorecards, hold a single 30-minute coaching session, and start weekly bottom-quartile reviews. This single step drives 30–40% of total savings.
Sync HVI inspection and PM data with fleet utilization. Late oil changes, neglected filters, and tyre issues start fixing themselves automatically.
Compare 30/60/90-day MPG vs. baseline. Roll out fuel-card alerts, route-optimization rules, and quarterly driver rewards. Savings compound from here.
Where HVI fits — the inspection & maintenance backbone of your fuel program
Fuel-efficiency software ecosystems usually include telematics, route planning, fuel cards, and driver coaching tools. The piece most fleets get wrong is the inspection-and-maintenance backbone that ties oil intervals, tyre condition, and engine health to actual fuel data. That's exactly what HVI was built for.
Guided pre-trip and post-trip checklists on the HVI app flag soft tyres, dirty filters, leaking seals, and DPF issues before they cost a single mile of MPG.
HVI tracks real engine hours and odometer data per vehicle and fires PM reminders at every interval — keeping oil fresh and engines burning fuel cleanly.
Any "Fail" in a driver's inspection creates an instant maintenance work order with photo evidence, vehicle ID, and DVIR reference — protecting fuel economy and compliance simultaneously.
Every inspection, repair, PM service, and fuel-linked event is indexed by VIN and date — searchable in seconds for managers, mechanics, and DOT auditors alike.
Most fleets running modern telematics still log oil changes on spreadsheets and chase DVIRs on paper. HVI closes that gap so the inspection-and-maintenance side of your fuel-efficiency program actually shows up in the numbers. Sign up for a free HVI trial and you can have your fleet's inspection profiles, PM intervals, and work-order workflow live in under an hour.
Frequently asked questions
Stop guessing where your fuel budget goes. Put it on a dashboard — and put HVI in charge of the inspection and maintenance side.
HVI replaces paper inspections, spreadsheet PM logs, and lost work orders with one digital platform that ties directly into your fuel-efficiency program. No hardware, no IT lift, savings measurable in the first 30 days.
No credit card required · Fleet-sized ROI in 30 minutes · Inspection + maintenance + fuel data in one platform