Fleet emissions numbers used to be a footnote in the sustainability report. In 2026 they're a line item in customer RFPs, insurance underwriting, and regulatory filings across the US, EU and UK. This guide walks through the methodology real fleet operators are using to measure Scope 1 emissions accurately, what the ISO 14083 and GHG Protocol frameworks actually require, and how to build a defensible carbon accounting system that runs off data your fleet already produces. Book a demo
Carbon accounting for fleets, done the way regulators and auditors accept
Fuel burn to grams of CO₂e per ton-mile. Real methodology, real data sources, no black-box conversions.
A defensible carbon number isn't complicated — but it does have rules. Get the framework right (ISO 14083 or GHG Protocol), get the data inputs right (fuel by unit, distance by trip, payload where applicable), apply the correct emission factors, and the number stands up to an auditor, a customer, and a regulator. Get any of the three wrong and you're either overreporting or exposed. This page breaks down each piece.
The three frameworks every fleet operator has to know
Carbon accounting for fleets sits at the intersection of three standards. They overlap in most places and diverge in a few important ones. If you report emissions to a customer, a regulator, or an ESG framework, you're already working under one of these — whether you named it or not.
ISO 14083:2023
What it is: The global standard for quantifying and reporting greenhouse gas emissions from transport chain operations. Replaced EN 16258 in 2023 and became the reference methodology for the EU's CountEmissionsEU proposal.
- Direct + indirect emissions (well-to-tank included)
- Choose credible emission factors (documented source)
- Report in g CO₂e per ton-km (freight) or per pass-km (people)
- Estimates allowed if transparent about methodology
GHG Protocol (Scope 1)
What it is: The most widely used corporate accounting standard globally. Categorizes emissions into Scope 1 (direct, from owned fleet), Scope 2 (purchased energy), and Scope 3 (indirect value chain, including hired transport).
- Scope 1 = fleet you own and operate
- Scope 3 = third-party carriers you hire
- Reported in metric tons CO₂e per reporting year
- Compatible with CSRD, CDP, SBTi and most ESG frameworks
EPA SmartWay
What it is: Voluntary US EPA program (since 2004) that certifies fleets on freight-emissions efficiency. Increasingly referenced in shipper RFPs and used to qualify carriers for sustainability-focused freight.
- Annual data submission covering fuel, miles, payload
- Efficiency scores in g CO₂ per ton-mile
- Truck & equipment technology criteria (skirts, low-rolling-resistance tires, APUs)
- Fleet performance ranked against industry percentiles
Two things worth internalizing about how these fit together. First: ISO 14083 and the GHG Protocol are largely compatible — ISO 14083's "direct emissions" bucket maps to GHG Protocol Scope 1. Second: SmartWay is complementary, not competing — SmartWay reporting produces the ton-mile efficiency metric ISO 14083 and shippers are asking for. Getting one right generally means getting the others right. Book a demo to see fleet emissions data structured for all three frameworks
The four-step calculation — from fuel receipt to a reportable number
The methodology is deceptively simple. What makes it hard is data hygiene — getting fuel, mileage and payload matched cleanly against each unit. Here's the sequence.
-
01CaptureCapture fuel consumption per unit, per period
Every gallon of diesel, gasoline, CNG or DEF consumed by each vehicle over the reporting period. Data sources: fuel cards, on-site fuel-station logs, driver fuel receipts, or telematics ECM data. Match consumption to the specific unit — not fleet-average estimates.
-
02ApplyApply verified emission factors
Convert fuel volume to CO₂e using accepted factors. US EPA emission factors: 10.16 kg CO₂ per gallon of diesel; 8.89 kg CO₂ per gallon of gasoline. Include CH₄ and N₂O contributions to reach total CO₂e. Under ISO 14083, factor source must be documented (EPA, DEFRA, IEA, GLEC).
-
03NormalizeNormalize by activity (distance, ton-miles, ton-km)
Divide total emissions by the activity metric your customers and framework require: total fleet CO₂e per mile, per ton-mile, or per ton-km. For freight this is the number that goes on customer scorecards and SmartWay submissions. Pull distance from odometer/telematics; pull payload from bills of lading or weigh-in data.
-
04ReportReport by scope, by unit, by reporting period
Aggregate to the required output: Scope 1 total in metric tons CO₂e (GHG Protocol / CSRD), g CO₂e per ton-km (ISO 14083), or g CO₂ per ton-mile (SmartWay). Retain the underlying data with audit trail — auditors verify inputs, not just totals.
None of the four steps require exotic software. What they require is that fuel, distance and payload data live in one system — not scattered across a fuel-card portal, a telematics dashboard, a dispatch spreadsheet and a shipper's TMS. That data-fragmentation problem is where most fleets' carbon numbers actually break down. Start free and connect fuel, mileage and PM data on one platform
The data inputs that decide whether your number holds up
Under an ISO 14083 or GHG Protocol audit, the totals matter less than the inputs. Here are the five data streams that make or break a defensible fleet carbon report — and where each one usually lives.
Fuel consumption
Primary source: Fuel card records, on-site fueling logs, telematics ECM data.
Watch out: Fleet-average or estimated fuel = unauditable. Auditors want per-unit gallon consumption.
Distance / mileage
Primary source: Odometer readings, ELD trip records, telematics distance logs.
Watch out: Empty-return miles count as much as loaded miles. Report both.
Payload & ton-miles
Primary source: Bills of lading, scale-house weigh-in data, dispatch/TMS records.
Watch out: ton-mile intensity is the metric SmartWay and customer RFPs actually score on.
Vehicle spec & class
Primary source: Vehicle registration / fleet inventory records.
Watch out: Different vehicle classes carry different emission factors. Spec accuracy matters.
Idle time & utilization
Primary source: Telematics ECM data, engine-hour meters.
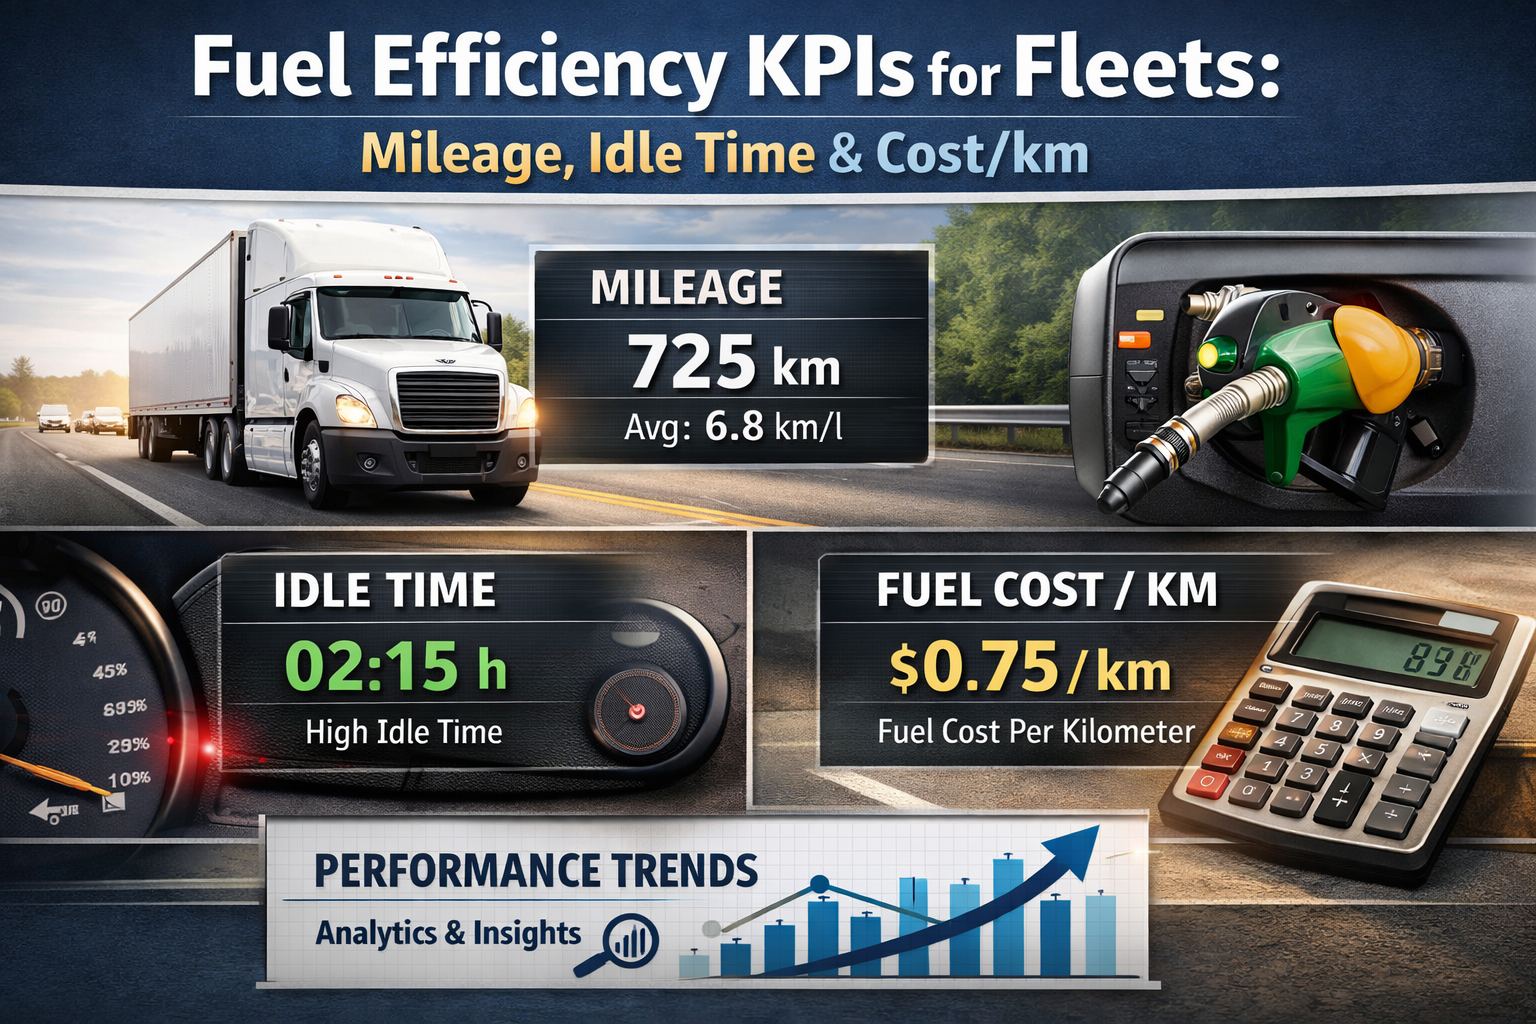
Watch out: Idle burns fuel that produces zero ton-miles — hurts efficiency scores disproportionately.
The pattern in all five: none of the data itself is exotic. What's exotic is capturing all of it against the same unit, over the same reporting period, in a system that can produce an auditable trail. That's the real value of a fleet CMMS with connected fuel and analytics — not the calculation, but the plumbing.
Six practical levers to actually reduce the number
Measuring the number is Step 1. Reducing it is Step 2 — and this is where fleet operators recover money while improving their reporting score. Every lever below appears in EPA SmartWay's own recommendations, and every one is measurable through the same data pipeline you're already using for the reporting.
Cut idle time to under 15%
Idle burns 0.8–1.5 gph producing zero ton-miles. Every hour recovered directly reduces g CO₂e per ton-mile. Highest-leverage single lever available.
Right-size PM & maintain aerodynamics
Underinflated tires, degraded aerodynamic devices and worn engine components all hit fuel economy. Well-run PM improves MPG by 2–5% — a direct CO₂e cut.
Spec low-rolling-resistance tires
SmartWay-verified LRR tires reduce fuel burn by ~3%. On a 120K-mile truck at 6.5 mpg, that's roughly 550 gallons and 5.6 metric tons of CO₂ per year, per unit.
Add trailer skirts & APUs
SmartWay-verified trailer skirts cut long-haul fuel burn 5–7%. APUs replace overnight idle with electric HVAC, eliminating hours of zero-productive burn.
Reduce empty-mile percentage
Empty-return miles emit the same per-mile as loaded miles but score zero ton-miles. Route optimization and load matching directly improve the intensity metric.
Blend renewable diesel or biodiesel
Renewable diesel typically cuts well-to-wheel CO₂e by 50–80% vs conventional. ISO 14083 accepts documented alternative fuel emission factors when applied consistently.
Every one of these levers reduces cost while reducing emissions. That's not coincidence — fuel is both the biggest line on the P&L and the biggest driver of Scope 1 emissions. The ESG report and the maintenance budget move together. Book a demo to see idle, MPG and fuel-per-unit trended alongside CO₂e reduction
From an ESG director who built a fleet carbon report from scratch
Two years ago our Scope 1 fleet emissions number was basically a spreadsheet estimate from average industry MPG. Nobody in operations trusted it, our biggest customer's sustainability team didn't accept it, and I couldn't defend it in any real audit.
What actually solved it wasn't a carbon accounting software — it was getting fuel logs, mileage and payload into the same system as our PM records. Once that pipeline was clean, the CO₂e number stopped being an estimate and became a calculation from actual per-unit data. Our SmartWay ranking moved up two percentiles in the first reporting cycle, and the number now holds up in customer RFP scoring.
Frequently asked questions
What is carbon accounting for fleets and why does it matter now?
Carbon accounting for fleets is the systematic measurement, reporting and verification of greenhouse gas emissions produced by a fleet's vehicles — primarily from fuel combustion. Under the GHG Protocol, direct fleet emissions are classified as Scope 1 (owned vehicles) or Scope 3 (hired transport). Under ISO 14083, they're categorized as "direct emissions" with the same practical meaning. It matters now for three reasons that have compounded quickly in the last two years. First, regulatory: the EU's CSRD requires large companies to report Scope 1, 2 and 3 emissions with third-party assurance, and the EU's CountEmissionsEU proposal will make ISO 14083 the reference methodology for transport GHG accounting. Second, commercial: major shippers and manufacturers now include verified carbon-intensity data in RFP scoring — carriers who can't produce audit-ready numbers lose freight. Third, operational: the same data that produces a defensible carbon report (per-unit fuel, distance, idle, PM) is also the data that reduces fuel and maintenance costs. The ESG report and the P&L move together.
What's the difference between ISO 14083, GHG Protocol, and EPA SmartWay?
The three fit together more than they compete. ISO 14083 is the global 2023 standard for quantifying and reporting greenhouse gas emissions from transport chain operations — it replaced Europe's EN 16258 and is the reference methodology in the EU's proposed CountEmissionsEU regulation. It defines how emissions should be calculated per ton-kilometre (freight) or passenger-kilometre. The GHG Protocol is the world's most widely used corporate accounting standard — it categorizes emissions into Scope 1 (direct, from owned vehicles), Scope 2 (purchased energy), and Scope 3 (indirect value chain, including hired carriers). Fleet emissions from your own trucks are Scope 1; emissions from third-party carriers you hire are Scope 3. EPA SmartWay is a voluntary US EPA program launched in 2004 that certifies fleets on freight emissions efficiency (grams CO₂ per ton-mile) and technology adoption (trailer skirts, low-rolling-resistance tires, APUs, idle reduction). In practice, if you're capturing per-unit fuel, distance and payload data cleanly, you can produce reports for all three simultaneously — the underlying data and calculation methodology are highly compatible.
How do you calculate CO₂ emissions for a diesel truck fleet?
The core calculation is straightforward: multiply gallons of diesel consumed by the emission factor to get total CO₂. The US EPA's standard emission factor for diesel is approximately 10.16 kg CO₂ per US gallon burned (gasoline is 8.89 kg per gallon). To get total CO₂e including methane and nitrous oxide, add small contributions from CH₄ and N₂O per the GHG Protocol's global warming potentials. For a Class 8 tractor averaging 120,000 miles per year at 6.5 mpg, that produces roughly 18,462 gallons of diesel per year, which multiplies to approximately 187,600 kg (roughly 223 short tons or 202 metric tons) of CO₂ annually per truck — consistent with published industry figures. To produce the intensity metric that customer RFPs and SmartWay scoring use, divide total CO₂ by total ton-miles hauled (loaded weight × distance). The math itself is simple; what makes accurate carbon reporting difficult is capturing per-unit fuel, per-unit mileage, and per-trip payload data cleanly against the same reporting period — without those inputs matched at the unit level, the totals are unauditable estimates.
Is Scope 1 fleet emissions reporting mandatory?
Increasingly yes, depending on your jurisdiction and customer base. In the EU, the Corporate Sustainability Reporting Directive (CSRD) requires large in-scope companies to report Scope 1, 2 and 3 emissions with third-party limited assurance — and the phase-in has been expanding through 2024-2026 to cover progressively smaller companies. The EU's CountEmissionsEU proposal will make ISO 14083 the reference methodology for transport emissions specifically. In the US, the SEC's climate disclosure rule went through court challenges and rulemaking updates, but many large US-listed companies are already reporting Scope 1 emissions under CDP, TCFD, or SBTi commitments. Beyond regulation, the commercial pressure is often more immediate: major shippers (retail, automotive, CPG) now include Scope 3 transport emissions in their own reporting, which cascades directly onto their carriers. If you haul freight for a Fortune 500 shipper, your carbon numbers are being reported whether or not you formally publish them — and increasingly, whether or not you have a contract depends on producing them accurately. Where reporting isn't yet mandatory, the practical answer is that it's becoming so quickly enough that fleets who wait are already behind.
How does HVI help with fleet carbon accounting and emissions reporting?
The single biggest challenge in fleet carbon reporting isn't the math — it's getting fuel, mileage, payload and vehicle spec data cleanly matched at the per-unit level, over a defined reporting period, with an audit trail. That's exactly the data pipeline HVI already runs for maintenance and cost tracking. HVI captures per-unit fuel logs (from fuel cards or manual entry), per-unit mileage (from odometer or telematics), digital pre-shift and post-shift DVIRs, PM history, work orders, and vehicle spec data on one platform. Applying verified emission factors (EPA, DEFRA, GLEC) to that data produces Scope 1 totals in metric tons CO₂e, intensity metrics in grams CO₂e per ton-mile or per ton-km, and the underlying audit trail your ESG team or third-party assurance provider needs. Published customer data shows the same fleets that use HVI for cost optimization report ~25% lower annual maintenance cost and ~3-month payback — the carbon accounting output is essentially a byproduct of running clean fleet data. For fleets facing CSRD, SmartWay submissions, or shipper RFP requirements, that consolidation is where fragmented spreadsheet workflows either scale or don't.
Auditor-defensible Scope 1 fleet emissions on the same platform running your maintenance
HVI captures per-unit fuel, mileage, payload and spec data, applies verified emission factors, and outputs the Scope 1 totals, ton-mile intensity metrics, and audit trail your CSRD, SmartWay and customer RFP submissions actually need — on the same platform running your PM, inspections and work orders. Live in under two weeks.
No credit card · No hardware · Emissions dashboard ready on day one