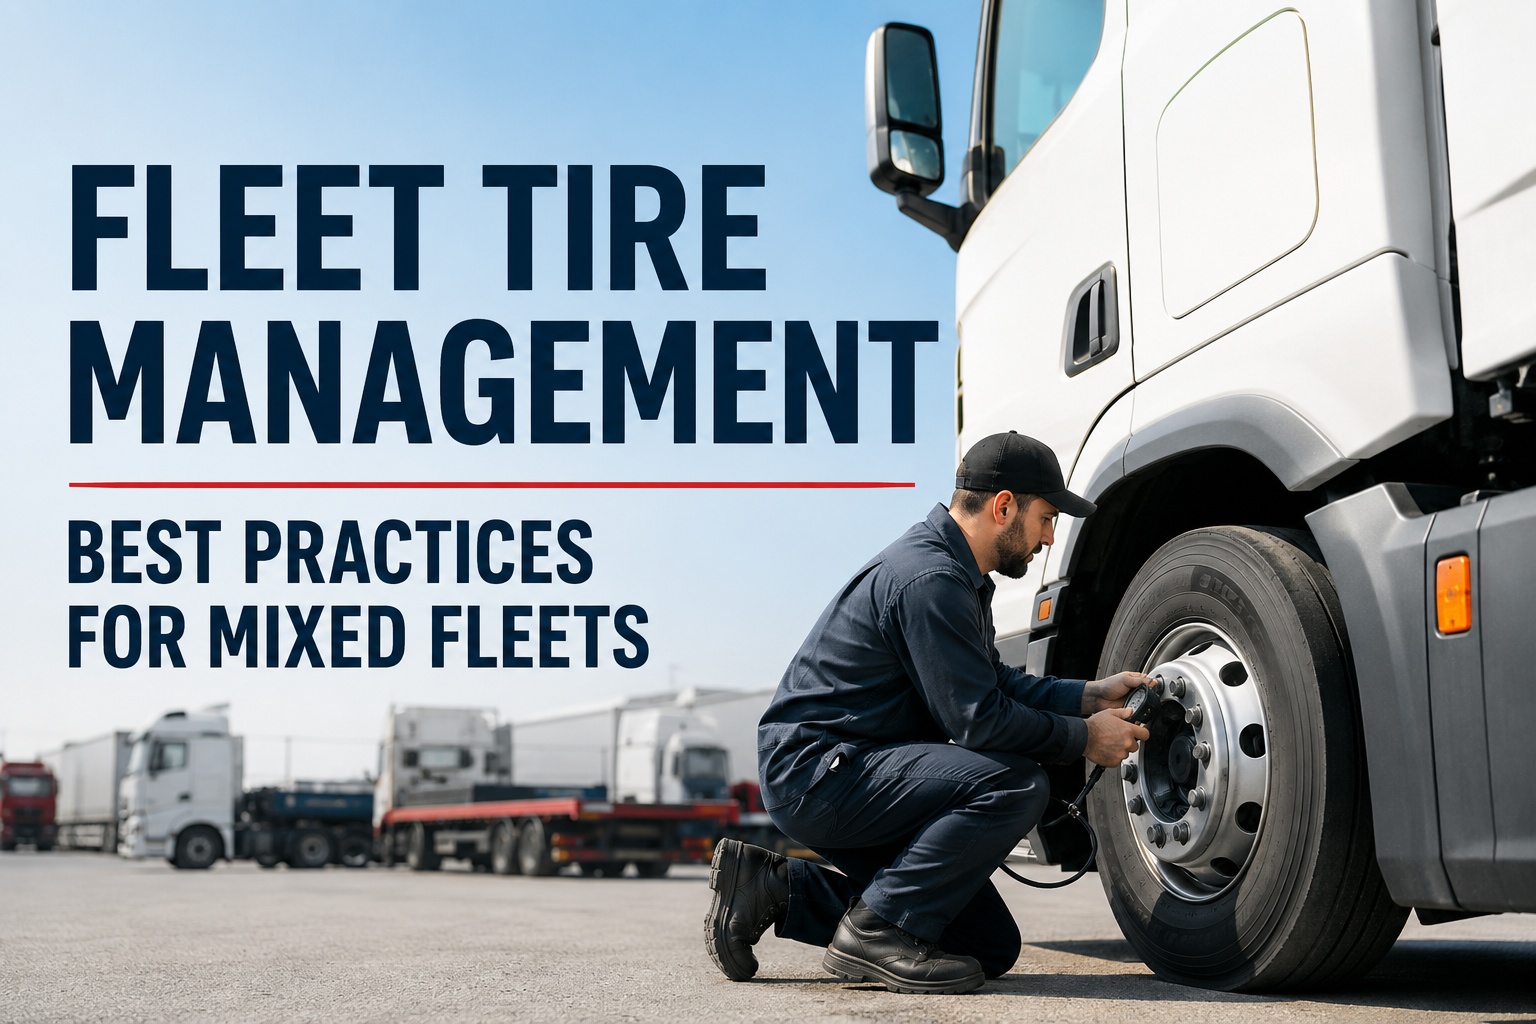
Fleet tire management is the discipline that turns the second-largest recurring cost on a fleet — tires at $0.03 to $0.05 per mile of operation, plus roadside call events averaging $600 to $1,200 each — into a controllable P&L line. Done well, it extends tire life 30% to 50% through retreading and pressure discipline, cuts roadside calls by half, and adds 1% to 2% to fleet MPG through correct inflation alone. Done poorly, it stays a mystery cost surfacing as downtime, blown steer tires, and premature replacements. This page walks the five metrics every fleet tire program tracks, the tire lifecycle through retread, the six wear patterns that diagnose real fleet problems, and the checklist for managing tires across mixed vehicle classes. Book a demo after you see the tire map.
This truck runs 10 tires. Track every one.
Real fleet tire management starts with per-tire, per-position visibility — pressure, tread depth, service history. This is what that actually looks like.
Every tire above is a small P&L. Correctly inflated, aligned, rotated, and inspected, a modern truck tire delivers 60,000 to 150,000 miles of steer service or 250,000+ miles across drive positions with retreading factored in. Neglected, the same tire fails prematurely, damages the casing, and turns a $500 asset into $250 of scrap plus a $900 roadside call. Below is what a real fleet tire management program tracks, the lifecycle stages every tire moves through, the six wear signatures that tell you exactly what's going wrong, and the best-practice checklist that ties it all together across mixed vehicle classes.
What good fleet tire management actually tracks
Every credible fleet tire management program tracks the same five metrics, and none of them show up on a fuel invoice or a monthly maintenance PDF. Miss any one and the whole program under-delivers, because tire wear is a compounding function — bad pressure changes the contact patch, which loads the alignment differently, which then wears the tire in a way that hides the original cause. All five have to run together.
Tire pressure (PSI)
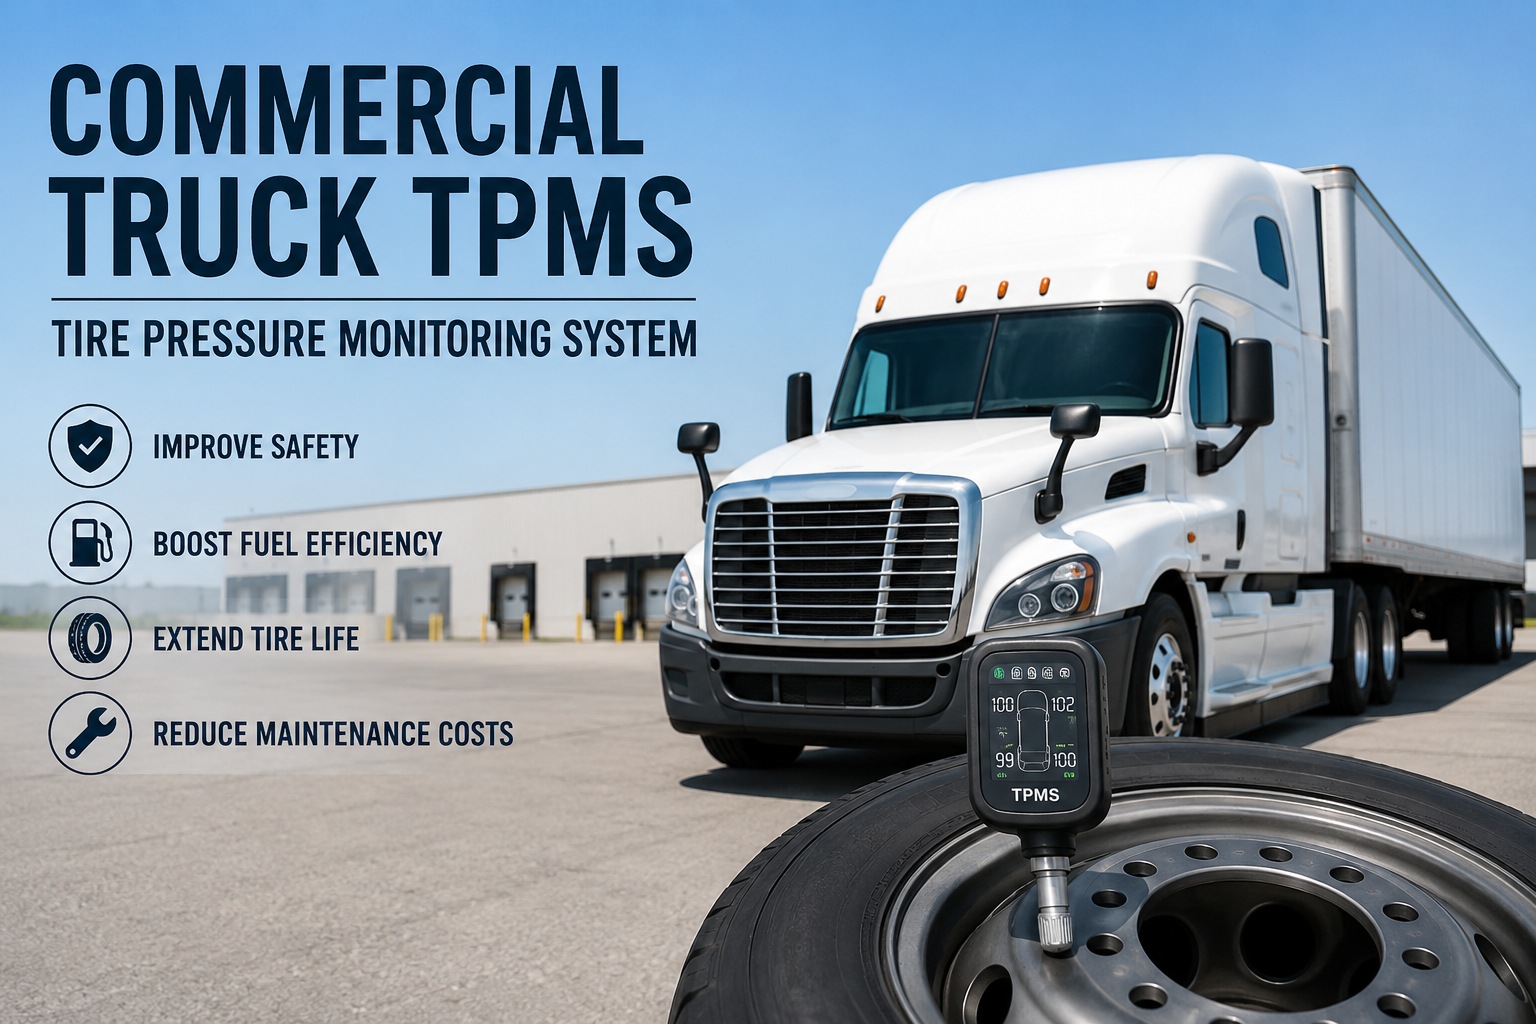
Underinflation by just 10% shortens tire life 15% to 20% and cuts MPG by 1% to 2%. Weekly gauge checks are the floor; TPMS on high-value routes is the ceiling.
Tread depth (32nds of an inch)
Legal minimum is 4/32" on steer, 2/32" on drive and trailer per FMCSA. Retread window opens at 8/32". Monthly measurement across all positions is the discipline.
Tire age & miles in service
DOT date code and miles since installation, per tire position. Tires age chemically even when unused; a 6-year-old spare is not a fresh tire regardless of tread depth.
Rotation status
Drive tires wear unevenly by position. Rotation every 25,000 to 40,000 miles per OEM spec equalizes wear and extends first-life mileage by 20%+.
Wheel alignment
Bad camber, toe, or caster can eat 20% to 30% of tire life. Alignment check quarterly and after any curb strike, collision, or unusual wear signature.
The five metrics are cheap to capture (a $10 pressure gauge, a $15 tread depth tool, a phone camera for DOT codes) and expensive to ignore. Fleets that log all five per tire per week reduce tire spend by 20% to 30% in the first year and cut tire-related roadside events by more than half. Book a demo to see the five metrics tracked per tire per truck
The tire lifecycle — and the retread window that changes the math
Every commercial truck tire lives through four distinct stages, and the difference between fleets that get 400,000 miles out of a single casing and fleets that get 150,000 comes down to what happens at stage three — the retread inspection window. Miss it, the tire goes to scrap. Hit it, the tire delivers a second life at 30% to 40% of the original cost per mile.
The retread saves roughly $320 per tire against a new-tire replacement, and a well-maintained casing accepts two to three retreads over its full life. On a fleet running 300 drive-position tires, moving retread capture rate from 40% to 70% typically recovers $60,000 to $90,000 a year in tire spend — all of it hidden inside stage three of the lifecycle above. Start free and log every tire's lifecycle stage on day one
The 6 tire wear patterns and what each is telling you
Every unusual tire wear pattern is a diagnostic message. Fleet mechanics have known this for decades; software just makes the messages easier to read by tracking wear position and rate per tire per week. Below are the six wear signatures that account for almost every "weird" tire pattern on a commercial fleet, what each is telling you, and the fix.
Center wear
Edge wear (both sides)
One-side wear
Cupping (scalloped)
Feathering
Diagonal wear
The pattern above the wear diagnosis is that every "tire problem" is actually a message about something else — pressure, alignment, suspension, or balance. Fleet tire management programs that log wear patterns per tire position surface the underlying issue on the tire schedule and route it to the correct shop workflow before another tire wears the same way. Book a demo to see wear patterns tracked and diagnosed automatically
Best-practice checklist for mixed fleets
Every practice below applies across mixed vehicle classes — the specific spec (PSI target, rotation interval, tread threshold) varies by Class 8, medium-duty, or off-road heavy equipment, but the discipline is identical. Check items off as you audit against your current program.
Every item above is zero-cost or near-zero-cost to implement; the return comes from consistency, not from any single high-tech tool. Fleets that check off all ten within 90 days typically report 20% to 30% tire cost reduction inside the first year. Book a demo to see this checklist running as a scheduled workflow — or start free and turn it into a daily protocol this week .
From a maintenance manager who ran the retread math
I used to think tire management was walking around the truck kicking sidewalls. When we brought in real tire tracking, the first month showed we were losing 8% to 10% of drive tires to underinflation-related casing damage — tires that should have been retread candidates instead of scrap. We were throwing away $180 of second-life value on every failure.
Now we run TPMS on our top 20 tractors and a strict weekly PSI check on the rest. Roadside calls dropped 60% in a year. Our tire cost per mile went from $0.048 to $0.032 across 84 trucks — about $130,000 a year we were quietly bleeding.
Frequently asked questions
What is fleet tire management?
Fleet tire management is the practice of tracking, maintaining, and optimizing every tire across a commercial fleet as a distinct asset with its own service history, cost per mile, and lifecycle stage. It combines pressure monitoring (weekly gauge checks or continuous TPMS), tread depth measurement, alignment discipline, rotation scheduling, and retread capture into one coordinated program. The goal is to move tires from being a mystery replacement cost that shows up as roadside events and unexpected downtime, to a controlled line item that delivers predictable cost per mile. A well-run fleet tire management program tracks the five core metrics (PSI, tread depth, age/mileage in service, rotation status, and alignment) per tire per wheel position, flags wear patterns that diagnose underlying vehicle problems, and catches every tire at the 8/32" retread inspection window — the single highest-ROI moment in the tire's life. Typical results across 25 to 500-truck fleets: 20% to 30% reduction in annual tire spend, roadside calls cut by more than half, and a 30% to 50% extension in average tire life through consistent retread capture.
How often should commercial fleet tires be inspected?
The minimum discipline is a weekly pressure check on every tire on every truck. Underinflation is the leading cause of premature failure and casing damage, and pressure drifts naturally between fills — ambient temperature swings, slow leaks, and load variation all move the number. Weekly gauge checks catch drift before it becomes damage. Tread depth measurement should happen monthly at minimum across every wheel position, using a digital depth gauge; the check takes under two minutes per truck and locates the wear that daily walkarounds miss. Alignment inspections belong on a quarterly schedule for all trucks, plus an immediate check after any curb strike, collision, or driver-reported unusual handling. Retread eligibility inspection triggers automatically at 8/32" remaining tread — miss this window by another 25,000 miles and the casing typically fails before it hits the retread shop. Daily DVIR pre-trips should include a tire section as a fifth line item behind lights, brakes, mirrors, and load: visual check for damage, obvious low pressure, and flagged positions from the maintenance schedule.
Are retread tires safe and cost-effective for commercial fleets?
Yes on both counts, provided the casing is inspected properly at the retread stage and the retread shop is reputable. Modern retreads on quality casings deliver 80% to 100% of new-tire life at 30% to 40% of new-tire cost — net cost per mile drops from roughly $0.045 on a new drive tire to $0.028 on a retread. FMCSA regulations permit retreads on all drive and trailer positions; retreads are prohibited only on steer axles of buses. The safety argument is settled by the numbers: most "shredded tire" debris on highways comes from underinflated tires (new or retread), not from retread failure itself. The economic argument depends on retread capture rate: fleets that inspect casings at 8/32" and retread 60% to 70% of eligible tires see the full ROI; fleets that let tires run to legal minimum and scrap the casing pay full new-tire economics forever. Retread capture rate is the single lever separating efficient tire programs from expensive ones.
What's the ROI on a fleet tire management program?
Typical fleets recover 20% to 30% of annual tire spend inside the first 12 months of implementing a disciplined fleet tire management program. On a 100-truck operation with $0.045/mile tire cost running 80,000 miles/truck/year, that's $360,000 in annual tire spend, of which $70,000 to $110,000 is recoverable through pressure discipline, wear-pattern diagnostics, alignment correction, and retread capture combined. Payback on the software plus rollout labor is typically 60 to 120 days. The savings compound because tire cost is a monthly recurring item — improvements this quarter show up as reduced spend every quarter thereafter, not as a one-time recovery. Beyond the direct tire savings, fleets typically see roadside tire calls drop 50% to 70% (each call averaging $600 to $1,200), unplanned downtime associated with tire failures fall proportionately, and the 1% to 2% MPG improvement from correct inflation add another $2,000 to $4,000 per truck per year in fuel savings on top of the tire number. Combined, the program often pays back three to five times its cost in year one.
Should mixed fleets use different tire policies per vehicle class?
Different specifications, yes; different disciplines, no. The policy structure — weekly pressure checks, monthly tread measurements, quarterly alignment, retread inspection at 8/32", DOT date logging — stays identical across Class 8 tractors, medium-duty trucks, off-road heavy equipment, and light-duty vans. What varies by class is the specific numeric target: a Class 8 steer tire runs 110 to 120 PSI, a medium-duty runs 65 to 85 PSI, a wheel loader runs 30 to 65 PSI depending on tire size. Rotation intervals shift too — long-haul Class 8 drives rotate at 40,000 miles, urban delivery medium-duty at 25,000, off-road equipment on operating-hour schedules instead of miles. The best-practice approach for mixed fleets is one policy template with per-class parameter tables — a single workflow with class-specific specs plugged in, rather than three separate programs. Software helps because the template lives once and the parameters live in the vehicle profile.
Turn tires from a mystery cost into a managed line item — per tire, per position
HVI logs PSI, tread depth, DOT date, and miles-in-service on every tire position across every truck; diagnoses wear patterns that trace back to alignment, suspension, and pressure issues; flags retread candidates at 8/32" automatically; and rolls all of it into the daily DVIR walkaround. Live in under two weeks — and typical fleets recover 20% to 30% of annual tire spend inside the first year.
No credit card · No hardware · Tire tracking ready day one