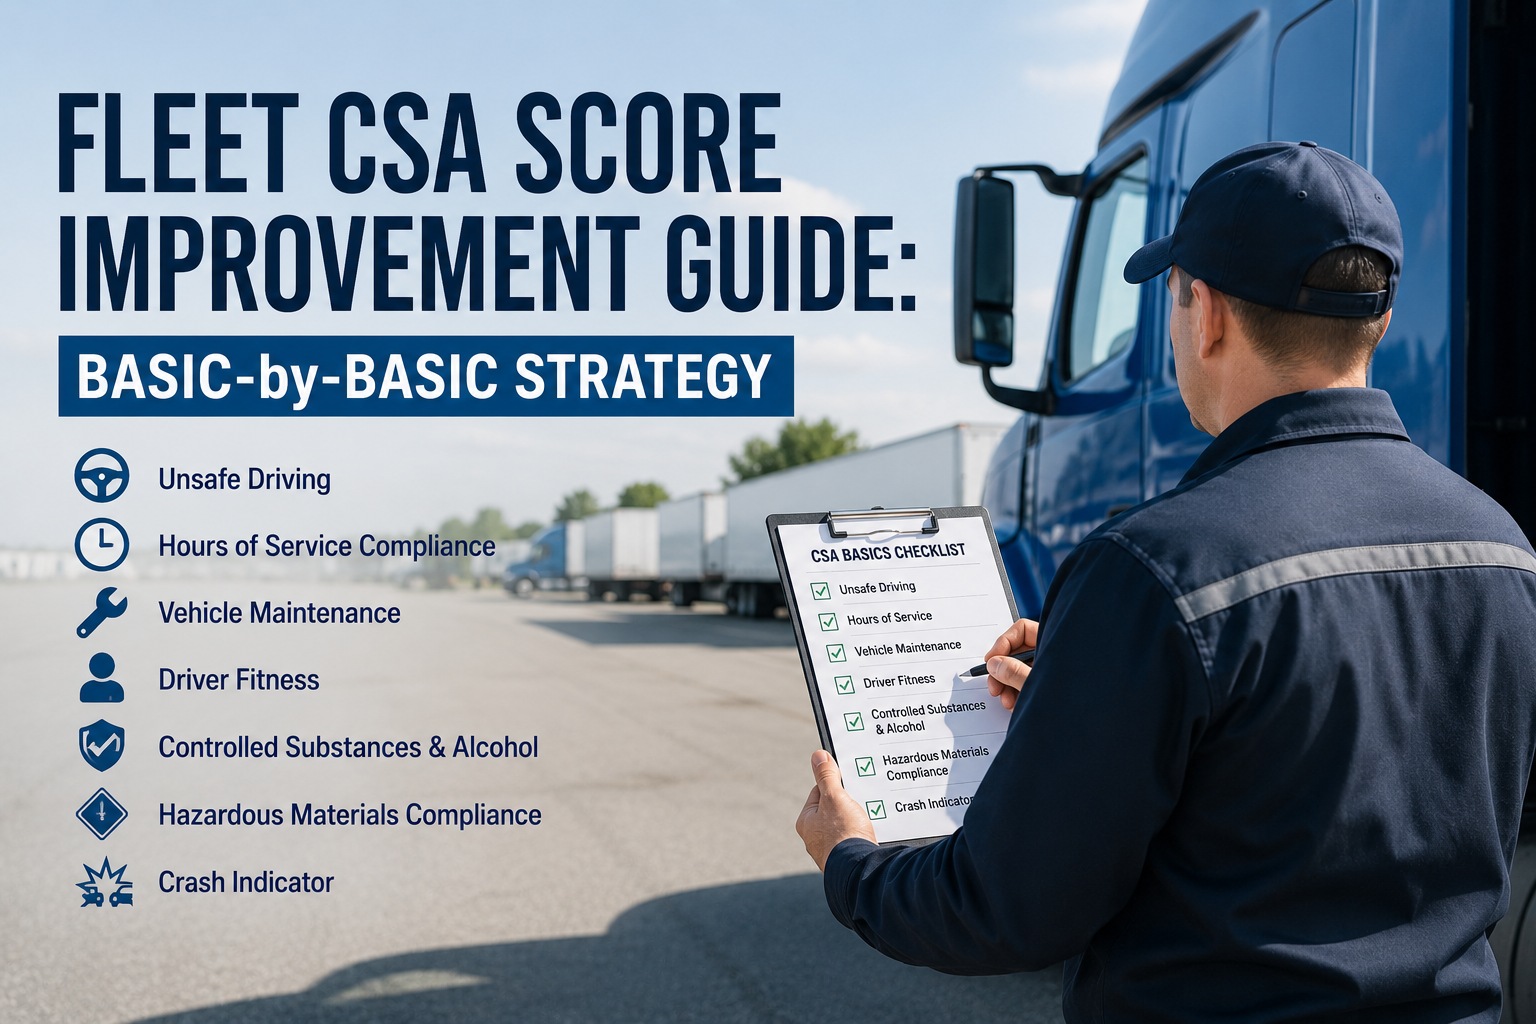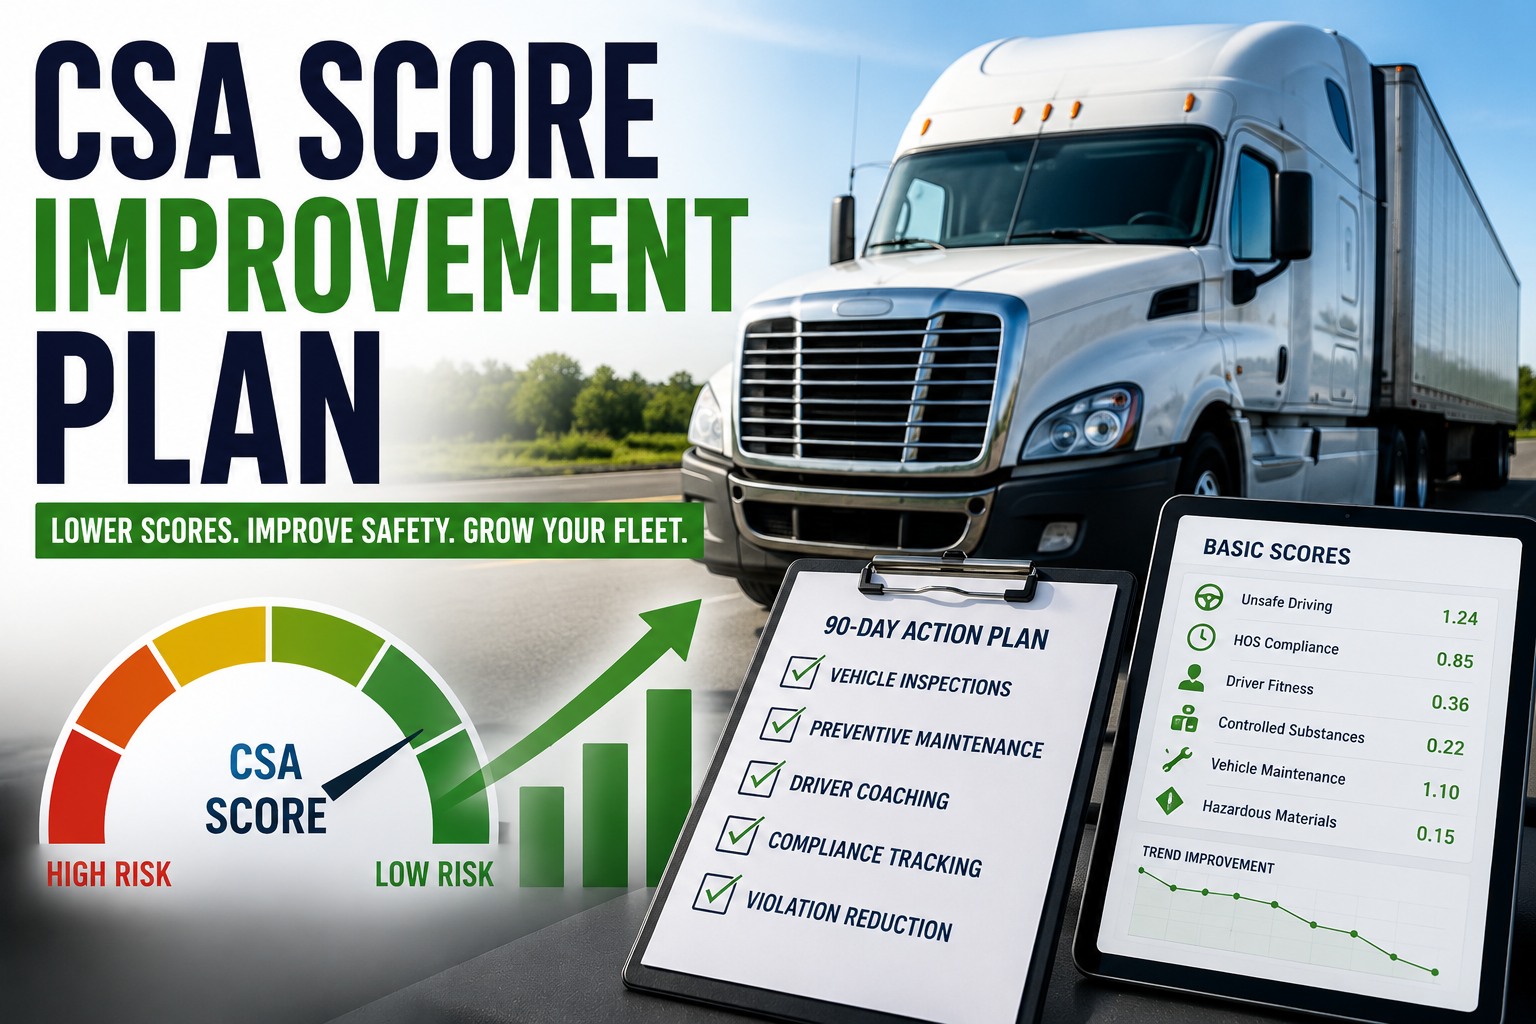
FMCSA CSA BASIC scores rank every US motor carrier's safety performance across seven Behavior Analysis and Safety Improvement Categories on a 0-100 percentile scale. Higher scores mean worse performance. Cross an intervention threshold and FMCSA sends warning letters, prioritizes you for roadside inspection targeting, and can trigger compliance reviews. Insurance underwriters pull the same public data and factor it directly into premium pricing. The 2026 SMS overhaul added a new Vehicle Maintenance sub-category and consolidated 950+ violation codes. Book an HVI demo to move each BASIC in the right direction.
Not all BASICs cost you equally. Three tiers separate real crash risk from paperwork risk.
FMCSA sets intervention thresholds based on how strongly each BASIC correlates with crash outcomes. Understanding the tiers is the difference between fixing the score that moves the needle and chasing the one that doesn't.
Strictest threshold. Direct safety risk. Cross 65% and FMCSA starts paying serious attention.
Brakes, tires, and lights make up 60%+ of all OOS violations. Vehicle Maintenance split in 2026 means DVIR quality now has its own score.
Still matters. But the raised threshold means fleets have more room before FMCSA action. Hazmat & passenger carriers face stricter thresholds (50-65%) in most BASICs.
Vehicle Maintenance split into Standard + Driver Observed. Driver Fitness threshold raised. Controlled Substances now covers all drug/alcohol + OOS violations. Score volatility reduced through group consolidation.
How the SMS actually calculates and moves your score
The Safety Measurement System aggregates every roadside inspection, DOT-recordable crash, and compliance review finding from the past 24 months into your carrier's MCMIS record. Each violation is assigned a severity weight from 1 (minor paperwork) to 10 (most severe safety risk). Out-of-Service violations receive an additional multiplier of 2 — doubling their impact compared to non-OOS violations in the same category. Time weighting then applies: violations from the most recent 6 months weight more heavily than those from months 7-24.
The resulting weighted score is compared against similarly-situated peer carriers (grouped by fleet size and operation type) to produce a percentile ranking from 0 to 100. Higher percentile = worse than more peers. The percentile is what triggers thresholds — not the raw violation count. This peer-comparison mechanism is why score improvement is achievable: reducing your violations relative to your peers moves you down the percentile regardless of absolute violation numbers. It also means small fleets with few inspections face score volatility — a single roadside stop can swing percentile significantly when your inspection volume is low. Book an HVI demo to see per-BASIC percentile trending against fleet-level operational data.
The 2026 SMS overhaul — what changed and why it matters
FMCSA finalized the most significant SMS methodology update in over a decade for 2026. The changes address scoring inconsistencies that had been building since CSA launched in 2010. Understanding what changed matters for every fleet planning score-improvement strategy.
Over 950 individual violation codes consolidated into approximately 116 violation groups. This reduces score volatility from minor code-level distinctions and creates more consistent scoring across similar violations.
Vehicle Maintenance now has two separate percentile scores: Standard (shop-detected defects like internal brake wear) and Driver Observed (walk-around items like lights, tires, coupling). DVIR quality directly affects a public score for the first time.
Driver Fitness intervention threshold raised from 80% to 90% after FMCSA analysis found lower crash correlation than previously assumed. Fleets have more room before action — but Driver Fitness violations still feed the broader compliance picture.
Controlled Substances/Alcohol category expanded to include all drug/alcohol violations plus OOS violations across additional categories. This BASIC now carries broader safety-critical weight in the overall CSA picture.
The 2026 overhaul is designed to make CSA scores more predictable and less volatile — a benefit for fleets with disciplined compliance programs. Fleets that have relied on scoring quirks or minor code distinctions may see percentiles shift under the new methodology. Try HVI free to align your compliance program with 2026 scoring methodology.
The moves that actually reduce each BASIC — category by category
Every BASIC has specific operational actions that move the percentile. Generic "improve safety" advice doesn't reduce scores — targeted actions per BASIC do.
Move: deploy in-cab cameras or telematics behavior monitoring with driver scorecards. Weekly coaching for bottom-20% drivers. Speed governors set at 68-70 MPH fleet-wide. Cell phone use policy enforced with real consequences. Seat belt compliance verified via camera. Behavior change happens by week 8-12 when scorecards become routine.
Move: verify ELD is on FMCSA registered list (56+ devices removed since Jan 2025). Reconcile unassigned driving time weekly. Ensure supporting documents (BOLs, dispatch records, toll receipts, fuel purchases) retained for at least 6 months. Driver training on HOS annotations. Random log audits monthly to catch pattern drift.
Move: driver behavior monitoring reduces preventable crashes (roughly 70% of all crashes have preventable elements). Document non-preventable crashes thoroughly and file DataQs challenges where evidence supports non-preventable status — success rates around 60% with proper evidence. Crash Indicator is private but heavily weighted.
Move: preventive maintenance intervals aligned to catch defects before OOS thresholds. Brake shoes replaced at 3/16"+wear margin (not at 3/16" absolute). Systematic annual DOT inspection tracking with 60-day renewal alerts. Work order completion rates measured monthly. Every defect requires documented corrective action.
Move: this is the newest BASIC (2026) and where digital DVIR gives the biggest score advantage. Photo evidence on tires, lights, coupling, and cargo securement at every pre-trip. Defect-to-work-order automation prevents dispatch with open defects. Fleets running photo-verified pre-trips consistently post Driver Observed percentiles 30-40 points below paper-based peers.
Move: consortium enrollment at correct random testing rates (currently 50% for controlled substances, 10% for alcohol). Pre-employment testing before every hire with Clearinghouse query. Annual limited Clearinghouse query per driver. Supervisor reasonable-suspicion training documented. Post-accident testing procedures rehearsed, not just written.
Move: complete DQ files for every driver including MVR from all states licensed in past 3 years, current medical certificate, road test certificate, previous-employer inquiries, and annual MVR review. Threshold raised to 90% in 2026 but violations still cascade into other BASICs. Digital DQ file tracking with expiration alerts prevents the annual medical/CDL renewal miss.
Time weighting — why old violations matter less
The SMS uses a time-weighted approach where recent violations affect your score more heavily than older ones within the 24-month window. Violations in the most recent 6 months carry approximately 3x the weight of violations from months 19-24. This time weighting creates strategic opportunities for score improvement.
Practical implication: fleets sitting at 85th percentile don't need to wait 24 months to see improvement. Aggressive compliance discipline focused on preventing new violations, combined with strategic DataQs challenges on questionable existing violations, typically produces 20-30 percentile point reductions within 6-12 months. The window doesn't wait for you — but neither does it hold your history against you forever. Try HVI free to accelerate the time-weighting cycle with clean-inspection accumulation.
The five mistakes that keep CSA scores high
Fleets attempting CSA improvement often fail not because the methodology is unclear but because they focus effort on the wrong things. These five patterns consistently prevent score improvement despite genuine effort.
Focusing on Driver Fitness (90% threshold, lower crash correlation) instead of Unsafe Driving or HOS (65% threshold, direct crash risk). Effort spent on the wrong BASIC doesn't move your compliance profile. Start with your highest-percentile Tier 1 BASIC.
The Driver Observed sub-category is new in 2026 and directly reflects DVIR quality. Fleets still running paper DVIRs typically score worst here. Photo-verified digital DVIR moves this specific score more than any other single change.
Every violation stays on your record for 24 months at severity weight 2 (if OOS). Filing DataQs Requests for Data Review on factually-disputable violations removes them entirely. Fleets that DataQs routinely reduce percentiles measurably; fleets that don't leave points on the table.
An OOS violation counts double a non-OOS violation. A recent violation counts 3x an older violation. A crash counts far more than a lighting violation. Score improvement prioritizes the categories with highest per-event weight, not the categories with highest violation count.
Percentile scores don't improve passively. They improve when clean inspections accumulate and violations age out. Fleets that don't run inspection-ready daily discipline don't accumulate clean inspections. The math is unforgiving: no clean inspections = no percentile dilution = elevated scores continue.
The pattern that separates fleets with improving CSA scores from those with stagnant scores: the improving fleets treat CSA as a systematic operational discipline, not an occasional cleanup project. Book an HVI demo to see BASIC-level trending automated across your fleet's compliance operations.
From a compliance manager who dropped 4 BASICs below intervention threshold
We came into 2025 with three BASICs above intervention: Vehicle Maintenance at 84th, HOS at 71st, Unsafe Driving at 68th. Warning letters had started arriving. Insurance renewal quote came back with a 22% increase. Broker relationships were getting harder to maintain.
We prioritized by tier. HOS and Unsafe Driving first because 65% threshold and direct crash correlation. Photo-verified DVIR deployment for Vehicle Maintenance because 80% threshold. Third-tier items pushed to Q3. Twelve months later: Vehicle Maintenance 42nd, HOS 47th, Unsafe Driving 44th. Driver Observed sub-category at 38th because photo evidence dominates that BASIC. Insurance renewal came in flat instead of the projected 15% increase. BASIC prioritization by tier is the only framework that works.
Frequently asked questions
What are the seven FMCSA CSA BASIC scores?
FMCSA's Compliance, Safety, Accountability (CSA) program tracks carrier safety performance across seven Behavior Analysis and Safety Improvement Categories (BASICs), with the 2026 Vehicle Maintenance split technically creating eight scored categories. Unsafe Driving covers speeding, distracted driving, seat belt violations, and other moving violations by drivers — 65% intervention threshold reflecting strong crash correlation. Hours of Service Compliance covers HOS regulation and ELD violations, driving fatigued, and record falsification — 65% threshold. Crash Indicator (private, not public) tracks 24-month crash history and severity regardless of fault — 65% threshold. Vehicle Maintenance (Standard) covers shop-detected mechanical defects, PM failures, and internal brake or drivetrain issues — 80% threshold. Vehicle Maintenance (Driver Observed), new in 2026, covers walk-around items catchable at DVIR including lights, tires, coupling, and visible leaks — 80% threshold. Controlled Substances/Alcohol covers drug and alcohol violations plus (as of 2026) all associated OOS violations — 80% threshold. Driver Fitness covers CDL qualification, medical certificates, DQ file completeness, and Clearinghouse status — 90% threshold (raised from 80% in 2026 after lower crash correlation was documented). Hazardous Materials Compliance covers HazMat violations for placarding, marking, documentation, and cargo — separate thresholds (typically stricter, 50-65% for hazmat and passenger carriers due to higher risk operations). Five BASICs are publicly visible; Crash Indicator and HazMat Compliance are private. All seven feed the same enforcement and insurance-underwriting pipeline.
How are CSA scores calculated?
CSA scores are calculated by FMCSA's Safety Measurement System (SMS) using a multi-step methodology. Data collection: every roadside inspection, DOT-recordable crash, and compliance review finding from the past 24 months is aggregated in the carrier's Motor Carrier Management Information System (MCMIS) record. Severity weighting: each violation is assigned a severity weight from 1 (minor paperwork) to 10 (most severe safety risk). Out-of-Service violations receive an additional multiplier of 2 — effectively doubling their impact. In 2026, over 950 individual violation codes were consolidated into approximately 116 violation groups to reduce scoring volatility from minor code-level distinctions. Time weighting: violations in the most recent 6 months carry approximately 3x the weight of older violations; months 7-18 carry roughly 2x weight; months 19-24 carry the lowest weight before rolling off entirely. Utilization factor: violation counts are normalized against carrier size and operational scale (vehicle miles traveled, average number of drivers, inspection volume) so small carriers aren't penalized simply for having a smaller absolute count. Peer comparison: your weighted, utilized violation score is compared against similarly-situated peer carriers grouped by fleet size and operation type. Percentile assignment: the SMS produces a percentile ranking from 0 to 100 for each BASIC. Higher percentile means worse performance than more peers. Percentile ranking — not raw violation count — is what triggers intervention thresholds. Scores update monthly as new inspection data enters the system and older data rolls out of the 24-month window.
What are the CSA intervention thresholds in 2026?
FMCSA sets intervention thresholds by BASIC based on crash correlation strength. 2026 thresholds after the SMS overhaul: Tier 1 (65% threshold): Unsafe Driving, Hours of Service Compliance, and Crash Indicator all sit at the strictest threshold because they show the strongest correlation with crash risk. Cross 65% in any of these three and FMCSA initiates warning letters, prioritizes roadside inspection targeting, and can trigger compliance reviews. Tier 2 (80% threshold): Vehicle Maintenance (Standard), Vehicle Maintenance (Driver Observed, new in 2026), and Controlled Substances/Alcohol share the moderate threshold. These BASICs still generate FMCSA action when crossed but with less urgency than Tier 1. Tier 3 (90% threshold): Driver Fitness was raised from 80% to 90% in 2026 after FMCSA analysis found lower crash correlation than previously assumed. Fleets have more room here before action, but Driver Fitness violations still feed the overall compliance picture and can compound with other BASICs. Special thresholds: Hazmat carriers and passenger carriers face lower thresholds (50-65%) in most BASICs because their operations carry higher inherent risk. Practical interpretation: below 50% in all BASICs means you're performing better than most peers. 50-64% means monitor closely; you're approaching thresholds. 65-79% in Tier 1 means you've exceeded threshold in the strictest categories; expect warning letters and increased inspection targeting. 80-100% represents serious concern where enforcement action is likely and brokers, shippers, and insurance underwriters may refuse to work with the carrier.
How can I improve my CSA BASIC scores?
CSA score improvement works through five combined strategies, prioritized by BASIC tier. First, prevent new violations through systematic daily compliance discipline. Photo-verified pre-trip DVIRs prevent Vehicle Maintenance Driver Observed violations. ELD supporting document workflows prevent HOS violations. Driver behavior monitoring reduces Unsafe Driving violations. Random consortium testing at required rates prevents Controlled Substances issues. Second, accumulate clean inspections. Every clean inspection dilutes past violations in the percentile calculation. Fleets that run inspection-ready daily see accumulated clean stops offset their older violations. Third, file DataQs Requests for Data Review on factually-disputable violations. Data entry errors and duplicate entries succeed at 70-90% rates. Dismissed citations with court documentation succeed at approximately 75%. Fourth, prioritize by tier: work Tier 1 BASICs (65% threshold, direct crash correlation) before Tier 3 (90% threshold, lower correlation). Score-improvement effort spent on the wrong BASIC produces limited enforcement or insurance benefit. Fifth, address the Vehicle Maintenance Driver Observed sub-category specifically. This 2026 BASIC directly reflects DVIR quality; digital DVIR platforms with photo evidence produce percentile improvements of 30-40 points within the first two quarters versus paper-based fleets. Realistic timeline: aggressive compliance discipline typically produces 20-30 percentile point reductions within 6-12 months across the targeted BASICs. Score improvements benefit not just enforcement risk but also insurance renewal costs (fleets crossing back below intervention thresholds see premium reductions of 8-15% at renewal) and shipper eligibility (many premium freight lanes require BASICs below specific thresholds).
How do insurance companies use CSA BASIC scores?
Insurance underwriters have full access to your SMS data through FMCSA's public website and factor it directly into premium pricing decisions. The pricing impact by score range is substantial. Below 50% across all BASICs: baseline pricing with potential discounts for exceptional records. 50-64%: modest premium pressure of 5-10% depending on the specific BASICs affected. 65-79% (approaching intervention threshold): premium increases of 10-30% depending on which BASICs and how long they've been elevated. Above 80% in one or more BASICs (above intervention threshold): premium increases of 30-50% or higher, with some carriers seeing non-renewal or declination entirely. Insurance underwriters focus most heavily on Unsafe Driving, Crash Indicator, and Vehicle Maintenance BASICs because these correlate most directly with future claim costs. Elevated Crash Indicator often triggers automatic declination at some underwriters regardless of other factors. Beyond premium pricing, several structural insurance impacts stem from CSA scores. Automated underwriting rules at some carriers decline any applicant with specific BASICs above threshold — the quote never gets to human review. Broker relationships suffer because some brokers now require minimum CSA percentiles for freight assignment. Shipper contracts increasingly reference CSA scores as eligibility criteria for premium lanes. Multi-year impact: because scores update monthly, insurance carriers can see improvement trends over 6-12 months. Fleets that demonstrate BASIC score improvement often qualify for renewal pricing improvements even when scores remain above ideal. Long-term CSA discipline consistently produces insurance cost improvements that exceed the operational cost of the compliance program itself.
Move each BASIC in the right direction — deployed in 5-7 days.
HVI ships with a BASIC-by-BASIC improvement framework covering all seven categories. Photo-verified DVIR for the 2026 Driver Observed category. ELD supporting document workflows for HOS. Driver behavior monitoring for Unsafe Driving. Clearinghouse automation and DQ file tracking for Driver Fitness. Per-BASIC percentile trending against operational data. Live for your fleet in 5-7 days.
2026 SMS overhaul aligned · 116 violation groups mapped · MCMIS-ready records · SOC 2 Type II