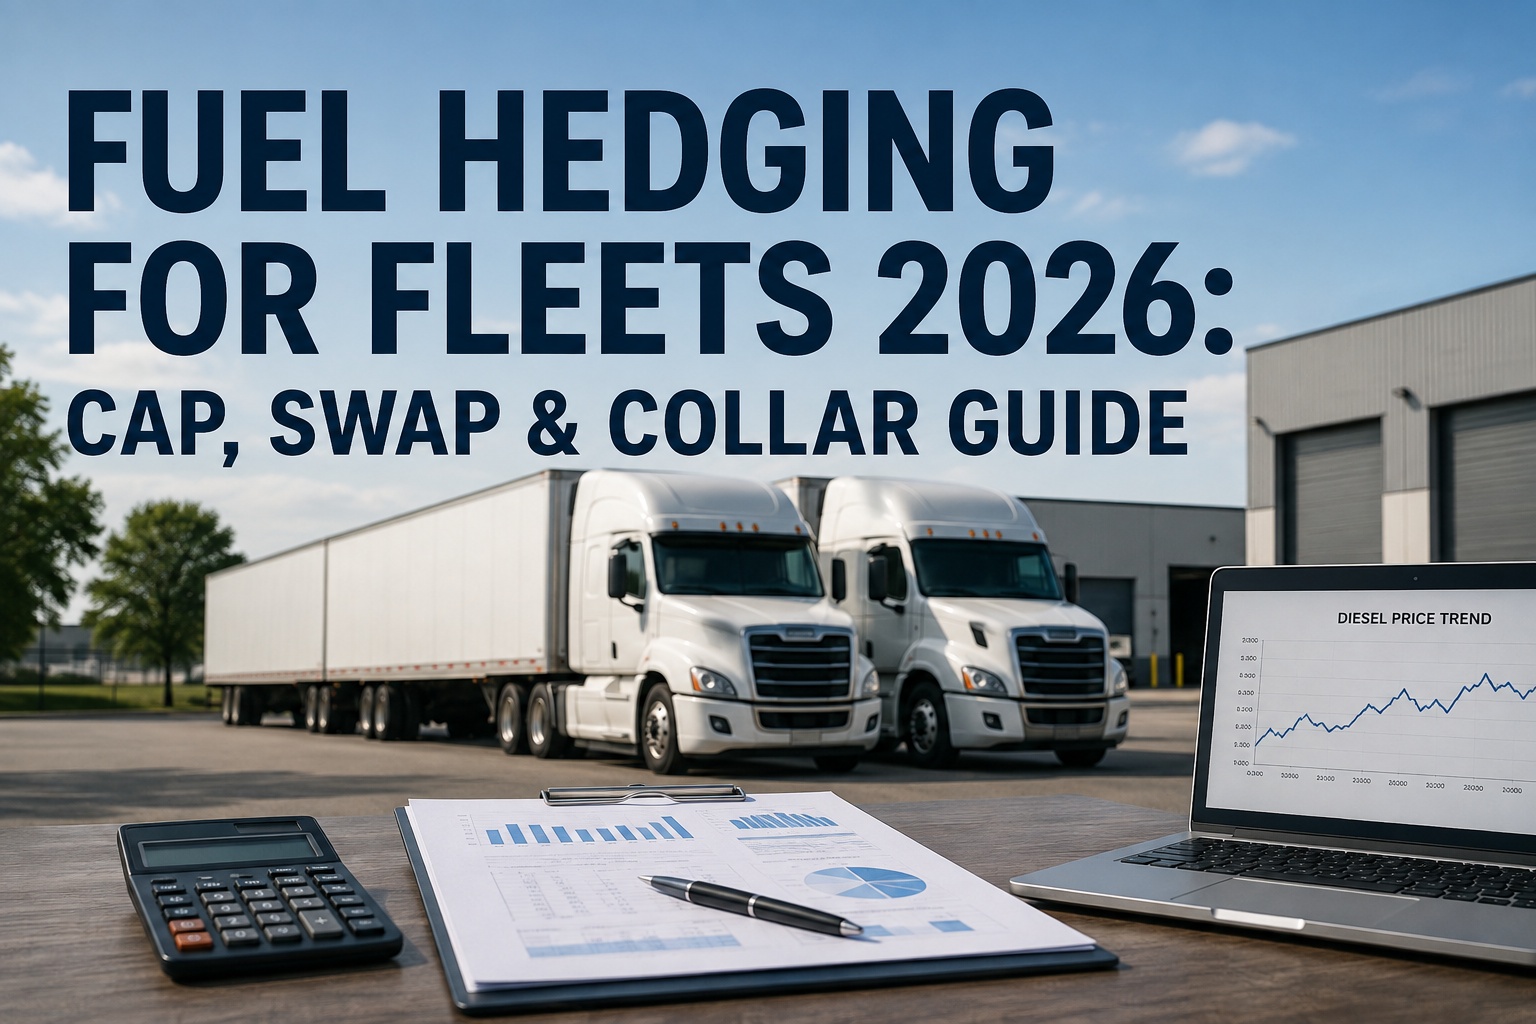
Fuel hedging for fleets is financial risk management, not fuel savings. A swap locks in your diesel price — win when prices rise, lose when they fall. A cap sets a ceiling and costs a premium. A collar bounds you in a price range and often costs nothing. None guarantees you pay less for fuel; they guarantee you know what you'll pay. For CFOs facing $4M+ annual diesel spend, the choice depends on volatility tolerance and pass-through capacity — book a demo to build your fleet fuel baseline in HVI.
Fuel Hedging Payoff Profiles — What You Actually Pay When Prices Move
Three instruments, three tradeoffs. Same $3.85 diesel today. Different bill in six months at $3.00, $3.85, or $4.75.
Illustrative pricing. Real premiums vary with volatility, tenor, and reference contract. Basis risk (ULSD futures vs your actual pump price) always applies.
The rest of this page walks basis risk (why ULSD futures don't perfectly track your pump price), hedge ratio strategy (layered vs single-tenor), the reference contracts fleets actually use (NY Harbor ULSD, Gulf Coast), fuel surcharge programs as a natural hedge, and how to build the operational baseline every hedge program needs before entering its first contract. Book a 30-minute demo to see per-truck fuel consumption capture in HVI as the baseline for any hedge program.
Basis risk — why a diesel hedge is never a perfect diesel hedge
Diesel has limited liquid futures of its own. Most fleet hedges use ULSD (ultra-low-sulfur / heating oil) futures traded on CME, or more loosely crude oil (WTI/Brent). Both are proxies. The gap between the hedge instrument price and the actual price your fleet pays at the rack or the pump is basis risk, and it is the single most misunderstood variable in every fleet hedging program. A well-designed hedge measures and manages basis explicitly. A poorly-designed hedge assumes basis is zero and gets blindsided when it moves.
| Reference contract | What it tracks | Typical basis vs pump diesel |
|---|---|---|
| NY Harbor ULSD (HO) | Wholesale ULSD at NY Harbor terminal | Historically closest proxy; basis widens during regional supply shocks |
| US Gulf Coast ULSD | Wholesale ULSD at Gulf Coast terminals | Common for southern/central US fleets; different basis than NYH |
| WTI crude | Crude oil at Cushing OK | Loose proxy; crack spread introduces significant basis risk |
| Brent crude | International crude benchmark | Even looser proxy; useful only for very rough hedge programs |
| Physical fixed-price supply | Direct wholesale contract with fuel supplier | Zero basis on contracted volume; supplier credit risk applies |
Basis risk becomes visible in extreme scenarios. Gulf Coast hurricane disruptions can spike regional pump prices while ULSD futures move less, producing hedge losses that don't fully offset pump price gains. Refinery outages, pipeline shutdowns, and geopolitical events all move basis. Sophisticated programs monitor basis history for their operating region and adjust hedge ratios accordingly — a hedge is worth more when basis is stable and worth less when basis is volatile. Book a demo to see actual pump-price tracking per region in HVI as your basis-risk baseline.
Hedge ratio — how much of your fuel to hedge, when
Few fleets hedge 100% of forecast fuel consumption. Over-hedging — locking in more volume than the fleet actually burns — converts a hedge from risk management into speculation, because volume that doesn't get consumed still settles against the reference price. A layered or laddered approach hedges a declining percentage of forecast volume further out. Airlines and mining companies publish their hedge books in filings; the pattern is remarkably consistent across sophisticated hedgers.
Near quarter: 40-55%
Hedge highest percentage on nearest quarter where volume forecast is most certain. Real 2026 example: LATAM hedged 37% Q3 through collars plus 8% via call options. Agnico Eagle: 54% of 2026 diesel exposure.
Second quarter: 25-35%
Reduce hedge ratio one quarter out. Volume forecast less certain; more room for actual consumption to diverge. LATAM Q4 2026: 27% collar coverage.
Third quarter: 10-20%
Further reduction. Business plan changes, contract wins/losses, and macroeconomic shifts all matter more at this horizon. LATAM Q1 2027: 12% coverage.
Fourth quarter: 5-10%
Minimal hedge on furthest-out quarter. Optionality preserved. LATAM Q2 2027: 7% coverage. Roll forward as time passes and the near-quarter volume becomes certain.
The ladder is refreshed monthly. As Q1 expires, Q2 becomes Q1 and the hedge ratio steps up; a fresh outer-quarter layer is added at low ratio. This produces smooth, predictable hedging behavior without concentrated exposure to any single price point. Fleets that hedge 100% at a single forward date create their own volatility: they win big or lose big depending on where prices settle. Fleets that layer produce moderate results in every scenario, which is what CFO-driven risk management usually values. Book a demo to see rolling fuel consumption forecast per unit in HVI as the input to your hedge ladder.
Fuel surcharges, physical fixed-price supply, and the hedge stack most fleets actually use
Most trucking fleets don't rely on financial hedges alone. A layered approach stacks natural hedges (fuel surcharge programs), operational hedges (fleet efficiency initiatives), physical hedges (fixed-price supply contracts), and financial hedges (swaps/caps/collars) into a total exposure management program. Each layer manages a different portion of the risk and complements the others.
Fuel surcharge programs
- Pass-through to shippers indexed to DOE weekly diesel price
- Natural hedge: covers most exposure on committed lanes
- Weakness: negotiated ratios rarely hit 100% pass-through
- Weakness: spot freight lacks the mechanism
Physical fixed-price supply
- Direct contract with fuel supplier at fixed rate
- Zero basis risk on contracted gallons
- Supplier credit risk applies
- Volume commitment usually required
Financial hedges (swap/cap/collar)
- Cover residual exposure after surcharges + physical
- Cash-settled against ULSD or crude reference
- Basis risk between reference and pump price
- Hedge ratio 20-55% typical for near quarter
Operational efficiency
- Idle reduction, aerodynamics, tire pressure discipline
- Reduces total exposure that any hedge has to cover
- Compounds returns of every other layer
- Zero counterparty risk
The stack matters more than any individual layer. A fleet with an 80%-pass-through fuel surcharge, 20% physical fixed-price contract, and a 40% collar on the residual has systematically de-risked its fuel exposure without over-committing to any single instrument. A fleet running only a 100% swap has replaced fuel-price risk with hedge-losses-when-prices-fall risk and has done nothing about basis. Most sophisticated fuel management programs are layered by design. Start a free HVI trial to build the consumption baseline every layer of the stack requires.
A fleet CFO on why the first hedge contract was the wrong one — and what changed
We're a $95M revenue regional carrier, 180 tractors mixed dry van and reefer. In 2023 we entered our first hedge program: 100% swap on our full annual diesel forecast, roughly 2.4M gallons, locked at $3.94/gal. Sounded prudent at the time; diesel was volatile and our CFO wanted budget certainty.
Then diesel fell to $3.20 through most of 2024. We paid $3.94 all year on a 100% notional hedge while the pump was cheaper. On the volume where our fuel surcharge already covered exposure we were double-hedged and losing on the financial side. Full-year hedge loss came in around $1.8M vs pump. Painful.
Rebuilt the program in 2025 with the actual consumption baseline our new fleet system had captured for 12 months first. Now we run: 75% fuel surcharge pass-through on committed lanes, 15% physical fixed-price with our terminal supplier, and a 30% collar on the residual near-quarter with $0.75 floor-to-ceiling width. Total hedge ratio on financial instruments is under 20%, layered forward 4 quarters. 2025 results: hedge P&L within +/-$180K on $8.9M diesel spend. That's the target. Certainty is not always the goal — bounded risk is.
Frequently asked questions
What is fuel hedging for fleets?
Fuel hedging is a financial risk management practice where a commercial fleet uses derivative contracts (swaps, options, futures) to reduce exposure to diesel price volatility. It is not a fuel-savings program. A hedge does not guarantee the fleet pays less for fuel; it guarantees the fleet knows what it will pay within a defined range. Three main instruments dominate fleet hedging. Swaps: lock in a fixed fuel price for a set future period; the fleet gains when market prices rise above the swap price and loses when prices fall below it. Caps (call options): set a ceiling on the worst-case fuel price the fleet will pay; the fleet participates fully in any price decreases but pays a premium up front for the ceiling protection. Collars: combine a cap (call option) with a floor (put option) to bound the fleet's fuel cost inside a defined range; often structured as zero-cost when the premium from selling the put fully funds the premium of buying the call. Most fleet hedges use ULSD (ultra-low-sulfur / heating oil) futures traded on CME as the reference contract, or the underlying crude oil for looser hedges. The choice of instrument depends on the fleet's volatility tolerance, hedge ratio strategy, fuel surcharge pass-through capacity, and CFO risk preferences.
Should a trucking fleet hedge 100% of its fuel consumption?
Almost never. Over-hedging — locking in more volume than the fleet actually burns — converts a hedge from risk management into speculation, because contracted volume that does not get consumed still settles against the reference price. If business slows and actual gallons consumed fall short of hedged volume, the fleet is exposed on the excess without any offsetting physical fuel purchase. Sophisticated hedgers use layered or laddered approaches that hedge a declining percentage of forecast volume as time horizon extends. Published examples: LATAM Airlines hedged 37% of near-quarter fuel consumption through collars, dropping to 27% one quarter out, 12% two quarters out, 7% three quarters out. Agnico Eagle hedged 54% of 2026 diesel exposure at a benchmark benchmark price. The ladder is refreshed monthly — as near quarters expire, outer quarters step up in hedge ratio and a fresh outer-quarter layer is added at low ratio. The layered approach produces smooth, predictable hedging behavior without concentrated exposure to any single price point. Fleets that hedge 100% at a single forward date create their own volatility: they win big or lose big depending on where prices settle. Layered hedges produce moderate results in every scenario, which is usually what CFO-driven risk management values.
What is basis risk in fuel hedging?
Basis risk is the gap between the price of the financial hedge instrument (typically ULSD futures at NY Harbor or Gulf Coast) and the actual price the fleet pays for physical diesel at the rack or pump. Because diesel has limited liquid futures of its own, most fleet hedges use ULSD (ultra-low-sulfur / heating oil) or crude oil as a proxy. The proxy is imperfect. Historic basis between NY Harbor ULSD futures and pump diesel varies by region, season, and market disruption. During Gulf Coast hurricane disruptions, regional pump prices can spike while ULSD futures move less, producing hedge losses that do not fully offset pump price gains. Refinery outages, pipeline shutdowns, and geopolitical events all move basis. A well-designed hedge program monitors basis history for the fleet's specific operating region and adjusts hedge ratios accordingly — a hedge is worth more when basis is stable and worth less when basis is volatile. Physical fixed-price supply contracts direct with the fuel supplier have zero basis risk on contracted volume (though supplier credit risk applies). Financial hedges always carry basis risk. Sophisticated fuel management programs typically combine physical and financial hedges to manage both price risk and basis risk together.
Does a fuel surcharge program eliminate the need to hedge?
Not entirely, but a well-designed fuel surcharge program is the single most important natural hedge a trucking fleet has, and it should be the first layer of any fuel exposure management strategy. Fuel surcharges pass through fuel-price changes to shippers via a formula indexed to a public reference (typically the US Department of Energy weekly diesel price). Well-negotiated surcharges cover 70-90% of fuel-price movement on committed contract lanes with credit-worthy shippers. Two important gaps remain: negotiated pass-through ratios rarely hit 100% (there is always a portion of price movement the fleet absorbs), and spot-market freight typically lacks the surcharge mechanism entirely (spot rates are all-in and fluctuate independently). Financial hedges cover the residual exposure that surcharges do not. A typical layered approach: 70-80% fuel surcharge pass-through on committed lanes, 10-20% physical fixed-price supply contract, and 20-40% financial collar on the residual near-quarter exposure. Total financial hedge ratio typically under 25% of fleet consumption. Fleets that skip the surcharge layer and rely on financial hedging alone routinely over-commit to the wrong risk and end up with hedge losses that could have been prevented by pricing discipline with shippers.
What operational data does a fleet need before starting a hedge program?
At minimum, 12 months of accurate per-truck, per-route, per-region diesel consumption data with dollar spend and pump-price basis captured. Without this baseline, the fleet cannot answer any of the three questions a hedge program requires. First, what is the exposure? Total forecast gallons over the hedge horizon determines the notional size of any instrument. Under-estimating leaves exposure unhedged; over-estimating creates the over-hedging risk that turns hedges into speculation. Second, what is the basis? Regional pump-price versus reference contract (NY Harbor ULSD, Gulf Coast ULSD, WTI crude) determines which instrument tracks the fleet's actual costs most closely. Fleets buying primarily at Gulf Coast terminals should not use NY Harbor ULSD hedges without adjusting for consistent basis differential. Third, what is the residual after natural hedges? Fuel surcharge pass-through on committed lanes and physical fixed-price supply contracts already cover a significant portion of exposure. Financial hedging should size only to the residual, not to total consumption. Fleets that enter hedge programs without this data typically overpay for coverage, over-hedge notional volume, and produce hedge P&L that swings widely with each quarter. Structured fuel data capture per unit, per route, per fuel purchase produces the operational baseline every hedge program needs before its first contract is written — and provides the ongoing measurement to prove or disprove the program's effectiveness quarter by quarter.
The operational baseline. Before the first swap. Every quarter after.
HVI captures per-truck, per-route, per-region diesel consumption with time-stamped gallons and dollar spend. Rolling 12-month forecast is a report, not a project. Regional pump-price basis versus reference contracts becomes visible per depot. After the hedge program launches, quarter-by-quarter P&L attribution shows exactly where the hedge helped or hurt. Live in under two weeks. No hardware. No credit card.
Trusted by CFO-led fuel management programs across USA, Canada & EU · Ready on day one